1
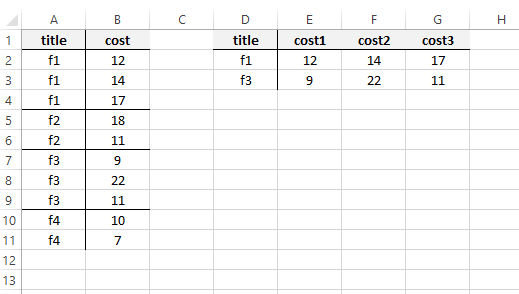
How can I extract the second table from the first one? I need to extract those titles that have exactly three costs (in the following example: f1 and f3). I tried using pivot tables but could not manage to generate the second table. Any advice would be appreciated!
UPDATE: I appreciate that Mike Honey offered a solution. However, since I'm not familiar with Power Query language at all, I am looking for a solution that uses no Add-ins.
There is some general resemblance between this problem and: Excel 2007 transpose/combine multiple rows into one; How to combine values from multiple rows into a single row in Excel?; and excel-2010-move-data-from-multiple-columns-rows-to-single-row. However, this problem differs in that the requirement is not just to transpose and aggregate data, but to do it only for those titles with exactly three costs.

Meysam
Posted 2014-08-18T19:52:06.543
Reputation: 630

Have you tried using pivot tables? By the way, you will need one extra column telling excel which cost(cost1,cost2...) a particular row has. – tumchaaditya – 2014-08-18T20:00:24.240
possible duplicate of Excel 2007 transpose/combine multiple rows into one and How to combine values from multiple rows into a single row in Excel?; see also Excel 2010 Move data from multiple columns/rows to single row and maybe others.
– G-Man Says 'Reinstate Monica' – 2014-08-18T20:05:07.730Those examples are a little different from this requirement. The requirement here is not just to transpose and aggregate data, but to do it only if there are exactly three costs. – fixer1234 – 2014-11-06T20:29:15.457
This question was posed three months ago and the single answer not accepted or upvoted. Do you still need a solution, or has it been overtaken by events and you no longer need it solved, or does Mike Honey's answer solve it? Please update the status so people will know whether to work on a solution for you. If the answer didn't solve the problem, clarify why, which will provide some direction. – fixer1234 – 2014-11-06T20:46:51.360
@fixer1234 Since I'm not familiar with Power Query language at all, I would be more interested in answers that use no Add-ins. I am still waiting for another answer. – Meysam – 2014-11-07T08:49:19.800
You can use the VBA solution from http://superuser.com/questions/244507/excel-2007-transpose-combine-multiple-rows-into-one and then use a filter on the results to get only those with 3 costs (e.g., filter out anything not blank for
– Excellll – 2014-11-07T16:57:10.957cost4and filter out blanks forcost3).@Meysam - you have great patience ... are you still waiting for an alternative? If so, you may have heard that Power Query will be built in to Excel 2016 - only a few more months away now. Would that assuage your scruples against Add-ins? Either way I really don't mind - it was an interesting learning opportunity for me and I am getting a ton of demand from my clients for Power Query projects these days. – Mike Honey – 2015-06-30T07:06:42.907
1@MikeHoney I am sorry Mike, I didn't mean to dismiss your answer and almost forgot about it. I downloaded your prototype and learned from it a a lot. I really appreciate your help buddy. – Meysam – 2015-06-30T18:24:44.273