Is there any way to drill down and see what System process is producing network traffic on my LAN?

1

1

I've got an XP machine acting as a server and a Windows 7 PC connected via wired LAN. Gigabit Ethernet b/t them.

Occassionally, usually after a long day, the connection to the server gets very slow. Today I pulled out the Resource Monitor and saw that the traffic (with only those two PCs on the network) was a steady 10 mb/s with nothing running between those two computers.

Resource Monitor showed over 95% of that traffic was from System.

Is there some way to drill down and see what System processes are generating that traffic?

Clay Nichols

Posted 2013-12-10T03:45:24.117

Reputation: 4 494

Answers

4

This is a bit more advanced than the NetBalancer suggestion from Amith (which looks like a nice program, but I have never tried it). However this method uses only free tools or ones already native to Windows.

You can download and use Wireshark to capture the network traffic going into and out of the computer. This will allow you to see they type of traffic that is being generated and the port numbers in use. For your purpose, after capturing data, it would probably be best to use choose the "Statistics" menu and open the "Conversations" report as this will sort the data into source/destination conversations.

From a elevated command prompt (click on the "Start Button --> type "cmd" in the search box --> right-click on "cmd.exe" in the found programs --> click on "Run as Administrator"), you can then run the command netstat -b which will provide you a list of all the computer's network connections.

Your output would look something like the below. The last connection is ESTABLISHED (currently open) from my computer using the local TCP port of 51888 going to stackoverflow on port "http" (the translated name for 80) and finally the binary that is associated with this connection is chrome.exe. If you don't want the IP address and ports to be translated, add a "-n" to the netstat command.

enter image description here

Find the entries that match the traffic you captured and this will tell you the program(s) using the connection.

YLearn

Posted 2013-12-10T03:45:24.117

Reputation: 1 741

This has little to do with the real process tracking. Wireshark doesn't suport it, the feature request was submitted 10 years ago, but is still unimplemented.

– Suncatcher – 2016-12-14T07:20:45.720

@Suncatcher, not sure what you are getting at with your comment. I never said that Wireshark provided this information. This method uses information from multiple sources that you correlate to get your answer. If you are looking for a specific process ID, netstat help clearly shows that the "-o" flag will give you this information. – YLearn – 2016-12-14T18:54:37.560

Netstat provide just a snapshot of connections at a certain moment, and without proper tool it is almost impossible (or very hard) to coincide these records with the destinations of Wireshark. – Suncatcher – 2016-12-14T19:02:02.103

@Suncatcher, the OP mentioned specifically that a condition of "steady 10 mb/s" existed. This is not a certain moment event. Will this answer every possible related issue? No, but it certainly addressed the issue the OP was asking about. – YLearn – 2016-12-14T19:04:14.587

Thanks for the tip on Stats mode. Wireshark was a bit ...overwhelming without that. – Clay Nichols – 2014-01-07T02:58:43.587

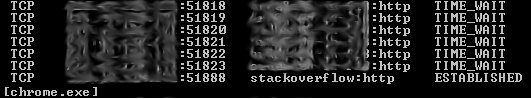
How can relate the address to a process (my goal being to find the offending process and perhaps disable it) relate the Address from/to (like Dell_74:51:ef and AsustekC_60:f7:83. (this conversation is 90% of the traffic, about 9 Mb/s. – Clay Nichols – 2014-01-07T03:30:16.150

@ClayNichols, you are probably looking at the Ethernet tab in converstations. Switch to the TCP or UDP view and this should correlate to the information from netstat. – YLearn – 2014-01-07T03:46:49.410

2

Pretty fresh from the press but looking very promising and definitely up to the task

Microsoft Message Analyzer

We are excited to announce the official release of Message Analyzer to the Microsoft Download Center. Sci-Fi movie references aside, this really is a new beginning for troubleshooting and analysis. Message Analyzer brings a set of new ideas, new techniques, and new paradigms in order to make analysis of protocols, log files, and system events a cohesive activity which allows correlation across all those types of traces.

Operating guide

Microsoft Message Analyzer is a new tool for capturing, displaying, and analyzing protocol messaging traffic and other system messages. Message Analyzer also enables you to import, aggregate, and analyze data from log and trace files. It is the successor to Microsoft Network Monitor 3.4 and a key component in the Protocol Engineering Framework (PEF) that was created by Microsoft for the improvement of protocol design, development, documentation, testing, and support. With Message Analyzer, you can choose to capture data live or load archived message collections from multiple data sources simultaneously.

Message Analyzer enables you to display trace, log, and other message data in numerous data viewer formats, including a default tree grid view, interactive tool windows, and other selectable graphical views that employ grids, charts, and timeline visualizer components that provide high-level data summaries and other statistics. Message Analyzer also enables you to configure your own custom data viewer charts. In addition to being an effective tool for troubleshooting network issues, Message Analyzer enables you to test and verify protocol implementations.

Lieven Keersmaekers

Posted 2013-12-10T03:45:24.117

Reputation: 1 088

1

You can use NetBalancer for this. It is a 30 day trial, but that should be enough to find out which process is using all the bandwidth and to take appropriate action:

As you can see here, you can see how much bandwidth a process uses and even limit the bandwidth for each process.

Amith KK

Posted 2013-12-10T03:45:24.117

Reputation: 205