1/3 octave band chart in Excel?

3

I want to create a 1/3 octave band chart in Excel 2007 but I can't find the way to do it. Excel only allows me to put the 'x' axis into a logarithmic one, but the scale for 1/3 octave band is not this one.

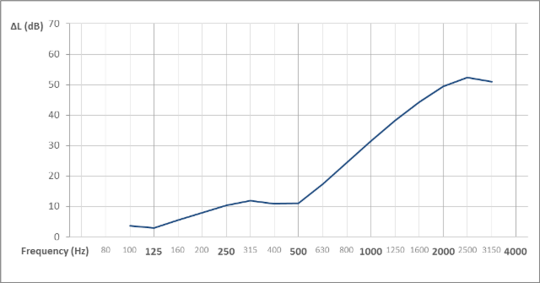
In 1/3 octave band chart the next values must be equaly spaced in the 'x' axis: 63, 125, 250, 500, 1000, 2000, 4000 (Hz). You can see here an example of a chart:

enter image description here

Can I do it with VBA Excel? or there is an easier way to do it?

Shivoham

Posted 2013-04-15T13:23:06.713

Reputation: 41

Answers

3

This can be done with an Excel line chart and some extra data series. Use the frequencies and values for your X and Y values. Then add two extra series, one for the major vertical grids and one for the minors vertical grids (all with a value of 0). Add error bars for your major and minor grids, with a value of +70. Format and label to taste.

Here's a sample:

1/3 Octave

dav

Posted 2013-04-15T13:23:06.713

Reputation: 8 378