0
Possible Duplicate:
Mac OS X: What is using my ‘active’ memory?
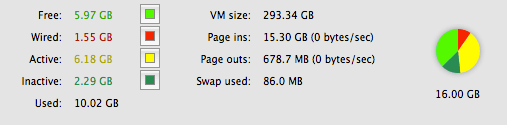
My activity monitor shows 6GB of active RAM usage:
Yet my Real Memory column shows nothing like that amount:
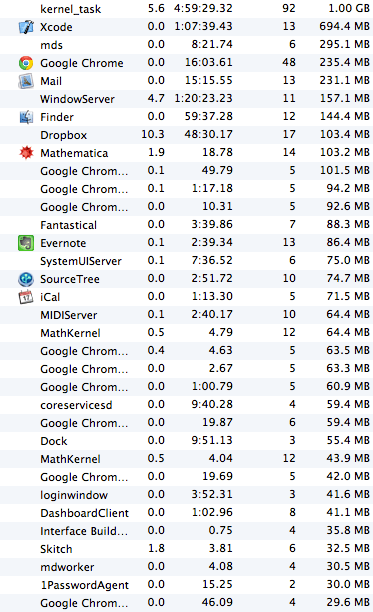
(There's another screenful below that, all smaller.)
Backing that up, the output from this command (which sums up memory usage of every running process):
ps -axm -o "rss,comm" | awk 'BEGIN { s=0;}; {s=s+$1;}; END { printf("%.2f GB\n", (s/1024.0/1024));}'
Gives 4.09GB, so it looks to me like 2GB has leaked. I see much wider ranges sometimes, perhaps 2 or 3GB from the ps command and as much as 7 or 8GB of Active usage reported by Activity Monitor.
I've tried quitting everything and logging my user out and back in again, but the Active usage is still far higher than the RAM reported by ps and by each process to Activity Monitor. This 2GB of active RAM is basically unrecoverable unless I reboot. Is there any way to a) detect what's leaking and b) get it back?
Thanks

Tim
Posted 2012-11-29T17:02:08.440
Reputation: 297

Is your system getting noticeably slower? I hate to ask, but: Do you want your RAM to be actually used or not? There's not really much point in having lots of RAM sitting around free, waiting to be used. (FWIW I do see less active memory being used for my MBP though – 3.64GB in contrast to 4.54GB as output from your
pscommand) – slhck – 2012-11-29T17:08:03.657@slhck yes, it gets slower as it comes close to the stops. I should have added that I see this usage growing slowly, very much behaving like a leak. – Tim – 2012-11-29T19:29:30.140
@DavidSchwartz I read that question. My issue is slightly different, in that there's a clear disparity between active usage reported by the sum of the processes and that reported by the OS. – Tim – 2012-11-29T19:31:49.563
Sigh Not a duplicate; the linked question was answered by matching the active memory reported in activity monitor to that reported by the processes using the
pscommand I listed. In my case, there is a significant and increasing difference, indicative of a leak. – Tim – 2012-12-01T14:34:58.687