Mac OS X: What is using my 'active' memory?

7

5

I'm using a recent MacBook Pro with 8 GB of RAM and after a few hours of using it at work I notice the amount of 'active' memory growing and growing.

Whenever I reboot my Mac, everything looks fine and it is hardly using any RAM. But after a few hours it looks like this:

Screenshot

As you can see, in this case it's about 4.3 GB.

Being a developer, I know that 'active memory' is the amount of memory that is currently used by running processes. So the first thing I did was quitting all applications and killing all processes that don't seem to belong to Mac OS X.

After I did that, my active memory came down about 400 MB, but got stuck at what you see in the screenshot. There are no more processes or applications to quit.

Now I'm wondering what is actually holding on to the memory? top and Activity Monitor don't report any processes with a high memory usage.

Any ideas?

Thanks!


Update 1:

Thanks to Doug Harris' answer I made this screenshot. It shows an active memory usage of 2.55 GB system wide, but only a 1.55 GB memory usage which the ps command calculates.

enter image description here

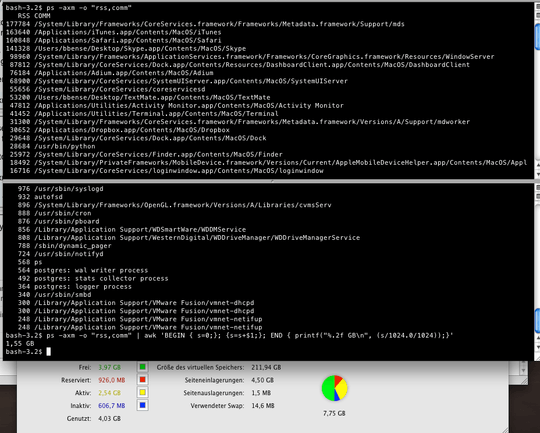
I'm not sure where the rest of the 2.55 GB is gone or where it is allocated. I have Instruments installed, but since this does happen over a span of a few hours, it is difficult to use Instruments. This feels like a memory leak somewhere in the OS. Maybe a driver (although I don't have any kernel extensions installed - checked with kextstat).

Personally I think it would be interesting to be able to see "more" about the memory management status. Under Linux there is some information under "/proc" available, afaik.

BastiBen

Posted 2011-02-11T14:34:35.537

Reputation: 435

you can use instruments to detect memory leaks and to record the complete monitoring. so why is it difficult exactly to use it? – matthias krull – 2011-02-13T12:35:44.263

Because the leaks happen over a couple of hours. I'm not even sure which process to monitor, since the memory is just gone. Using Instruments to find leaks pulls a lot of CPU and memory to do the recording, which is not good for monitoring a over a long period of time. – BastiBen – 2011-02-13T12:41:02.197

Answers

4

Even though no single process has high memory usage, there are still lots of processes running -- that all adds up.

Using ps and other command line tools, you can drill deeper into this.

First, use options to ps to limit what is shown to just resident memory and the name of the command. -m sorts output by memory usage, -a shows all users' processes, -x shows processes not associated with a terminal (i.e. most mac apps).

$ ps -axm -o "rss,comm" 

Here's the first few lines I see:

   RSS COMM
210256 /Applications/Firefox.app/Contents/MacOS/firefox-bin
158276 /Applications/Google Chrome.app/Contents/MacOS/Google Chrome
155360 /Applications/iTunes.app/Contents/MacOS/iTunes

It's no shock to me that these are at the top (and the Chrome process shown is just one of a bunch). The RSS column is expressed as 1024 byte blocks. So iTunes is using about 151.7 MB.

That output is formatted well enough that you could throw it into a spreadsheet to analysis if you like analyzing things that way. I'll stick to the command line a little longer

String together a bunch more to see the sum of all processes:

$ ps -axm -o "rss,comm" | awk 'BEGIN { s=0;}; {s=s+$1;}; END { printf("%.2f GB\n", (s/1024.0/1024));}'

The output I see for that is 2.44 GB, not exactly what I see for Active memory in Activity Monitor, but close enough that I can use ps to get to the bottom of this.

You can add together just those processes using more than 100MB:

$ ps -axm -o "rss,comm" | awk 'BEGIN { c=0;s=0;}; ($1 > 100000) {c=c+1;s=s+$1;}; END { printf("%.2f GB from %d processes\n", (s/1024.0/1024),c);}'

0.98 GB from 8 processes

I haven't told you exactly what is using your mac's memory, but these tools will help you discover.

Doug Harris

Posted 2011-02-11T14:34:35.537

Reputation: 23 578

Wow. Thanks a lot for this guide. I restarted my Mac by now, but I'm sure my memory will be full in a short while again so I can try this. In the meantime, have an upvote! – BastiBen – 2011-02-11T15:33:34.657

Edited to include -a option to show processes owned by users other than me. – Doug Harris – 2011-02-11T16:14:20.017

Updated the original post to reflect what I found out so far. – BastiBen – 2011-02-13T12:33:02.643

1

man -k DTrace. Those tools are the ones that will solve this. Goodluck

chiggsy

Posted 2011-02-11T14:34:35.537

Reputation: 472

0

It sounds like one of the system processes is leaking memory (either that, or increasing numbers of system processes are being run for some reason). You can check this directly in Activity Monitor by switching the pop-up menu in the toolbar from My Processes to All Processes, then sorting by the Real Mem column. Look for processes using lots of real memory, and/or lots of instances of the same process name. This won't solve the problem, but should at least give you an idea where it's coming from.

Gordon Davisson

Posted 2011-02-11T14:34:35.537

Reputation: 28 538

I tried doing that before, but my main problem is that there are simply no processes that take up that much memory. – BastiBen – 2011-02-12T06:47:06.957

In that case Doug Harris' approach may let you do more detailed analysis (e.g. in a spreadsheet). I would recommend making some sort of record of what the stats look like when the system was recently rebooted (whether records of ps output, screenshots of Activity Monitor, whatever) so you'll have something to compare with when the system's been running awhile and is using lots of memory. Find what changes in the process list as it runs, and it should point you at the problem. – Gordon Davisson – 2011-02-12T13:40:04.650

0

To me, it seems like active memory is just free'd memory available for reuse, but not specifically marked as "free"

Yann Bizeul

Posted 2011-02-11T14:34:35.537

Reputation: 1

3Source for that "it seems to me"? We like precise answers, supported by references. – vonbrand – 2013-05-03T22:25:08.937