If you're looking for a predicted DATE when the Number Updated reaches 660, you need to write some formulas.
I did this in a spreadsheet I was using to track Backup growth at a previous job. The solution does not involve the graph, it uses the FORECAST() function of Excel.
The syntax is:
=FORECAST(X, Yrange, XRange)
In your case X equals 660, Yrange is the Date, and Xrange is the Number of Successful Updates.
So if your dates are in column A and the TOTAL number of successful updates is in column B, and you've got less than a thousand values entered already, you'll put the following formula in a spare cell somewhere:
=FORECAST(660, A1:A1000, B1:B1000)
In my experience I was unable to tell it to just use all column values (A:A) without it failing somehow, so I had to set some arbitrary limit (A1:A1000) for it to work.
Format the cell you put this formula in as Date and you'll get a prediction as to when your number of installs will equal the number of users.
Excel Tips was a great help in finding this information for me back when I was building the spreadsheet myself: http://excel.tips.net/T002573_Using_the_FORECAST_Function.html
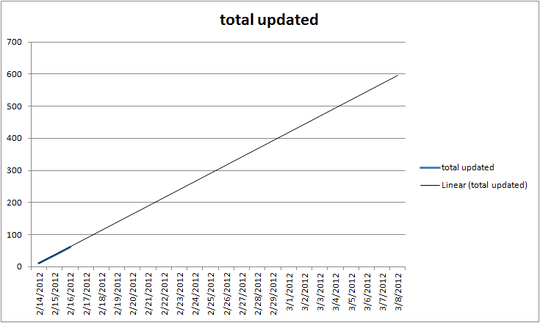


Are the two axes of your graph Number Updated and Date? And if so, are you looking for a prediction as to what date all the users will have received the update? Please update your question to clarify. – music2myear – 2012-02-17T14:44:03.317