Let's start at the top, and then we dig deeper than ever.
While you can run random tools like Process Explorer or Automatic Runs, poking around in them won't show you everything and there would still be things hidden under the grass. And if you go around disabling programs and changing your drivers, you are most likely fixing something that ain't broken.
As with every scientific research, we first have to determine the cause before coming to a solution...
Stuck? Get better ideas, divide and conquer your options and put things to the test.
Windows Experience Index
The quickest way to identify whether it's not just the hardware...
Under Control Panel\All Control Panel Items\Performance Information and Tools you can find the Windows Experience Index, known as a good way to asses key system components.

Sometimes your computer just doesn't fit your daily needs anymore...
In above example, this would require one to investigate the hardware this computer has and do an attempt at upgrading drivers; if not, time to upgrade that copmuter. That's how far hardware goes...
Resource Monitor
A good overview of what's going on on your computer, no download required...
Under Control Panel\All Control Panel Items\Administrative Tools you can find the Resource Monitor, it is also accessible from the Task Manager by the click of a button. This gives a very nice overview of the CPU / Memory / Disk / Network of the applications and services on your system.

Firefox and AVP? Smells like excessive virus scanning while browsing. And do I need wmpnetwk.exe?
No need to fire up Process Explorer or Process Monitor, because this beast also shows the System Interrupts and even allows you to filter. And in case there's something wrong with that, DPC Latency Checker and LatencyMon can help you to quickly pinpoint the issue. But why not install a much more insightful tool instead?
Windows Perfomance Toolkit
Comes with the easy Recorder and an insightful analyzer, no problem escapes your eyes...
These tools are available in the Windows ADK, which is for Windows Vista and above. Please note to only select Windows Performance Toolkit during the installation, because the other tool takes quite long to download and is only meant for professionals.
And then you can finally start the Windows Performance Recorder, only check the things you need and then start tracing. After you caught the slow moment, you can stop tracing and it will save the trace to a location you can easily find back.
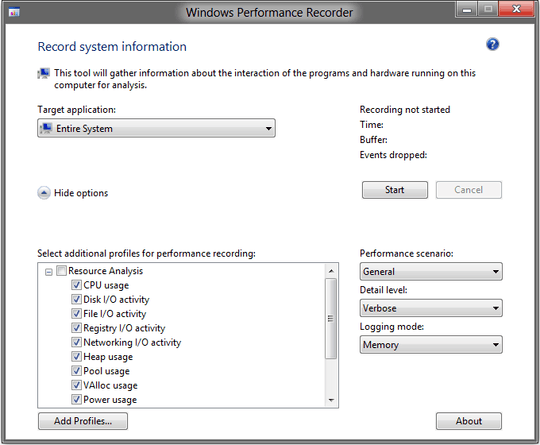
Last time I mentioned this, you had to do this all with the command-line... Welcome to 2012!
Yes, this can also be used to trace shutdown/(re)boot/standby/hibernate/resume/fastStartup scenarios.
Now, let's look at what 10 seconds of pretty idle performance look like.
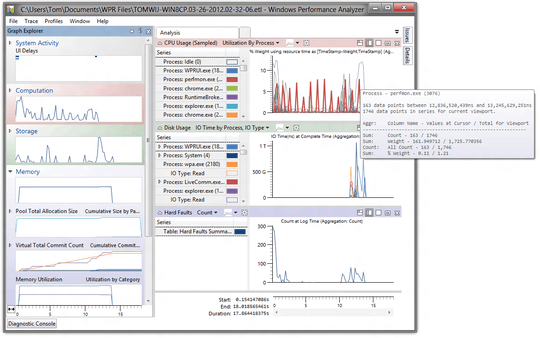
Oh no, I forgot to close Resource Monitor, look how consuming its graphs are...
From the left side, you can expand the graph sections and drag the graphs you want to the right side. In the right side you can manipulate the graphs in many way; hovering, clicking and right clicking should teach you some things. Not to forget about the tabs in the top or the annotation features at the right.
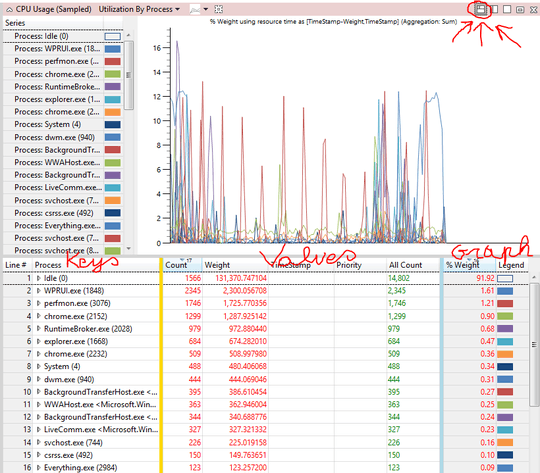
Yeah, tables of performance data with yellow and blue bars...
In the above image you can see that by the click of a button you can get a table under your graph. By right clicking on the columns header you can add/remove columns (there are some not shown).
Note the yellow and blue bar. Anything before the yellow bar are considered to be the keys of that row, it is used as the series for the graph. The values between the yellow and blue bar are aggregated (usually summed), because its not just about a process but rather about the stacks the threads of the process walked. Then last, you can graph columns and give them a color. If you drag a start time and an end time here, it will even change the graph to show horizontal bars (to show when things started and stopped)...
Now, what about the drivers?
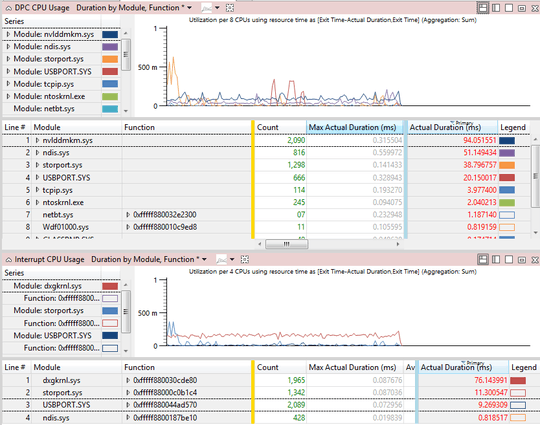
Nvidia is kind of resource heavy, and seems I couldn't resist moving my mouse around...
Windows Assesment Console
If you can't get enough, this one runs for hours and generates tons of XML / WPT data for you to analyze. Not for the faint-hearted, it's also available from the Windows ADK. It's useful for professionals, but is in most cases really not needed...


Yes, my dear system, I've dug so deep that you have no performance secrets for us.


the simplest way is to never get that kind of computer for windows use again.... since this may be related to some totally unknowable and unfindable hardware bug (unless you know vast quantities of totally obscure debug knowledge)... return to store if possible... oh wait you aren't talking about installing windows... if there is a rootkit and MBR virus it may be simplest to back up files with a (linux) live cd hose the drive with zeros with dd, and reinstall windows.. if its just windows being stupid (all OSes do) that will also be fixed – conspiritech – 2012-03-25T18:48:15.343
@conspiritech they mean a current working installation that is slow to respond. – Moab – 2012-03-25T19:22:52.890
then go with the bottom half of the comment – conspiritech – 2012-03-25T19:23:29.543
Turn off pretty much all of the start-up procceses using msconfig, reboot, CCleaner, defrag, virus scan, reboot, ccleaner and defrag..reboot =p. That's what I would do, but that is just me. (and vista sucks =p) – cutrightjm – 2012-03-25T21:19:45.450