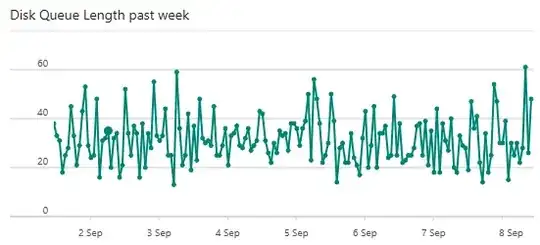
We are having a battle with the Microsoft Azure support team. I hope the Serverfault community can chime in as the support team has messed us about before.
Here is what is happening.
As part of a larger SaaS service that we host on Azure, we have a front-end App Service that accepts basic HTTP requests, carries out some minor validation and then passes the grunt work on to a back-end server. This process is not CPU, memory or network intensive and we don't touch the disk subsystem at all.
The pricing tier is 'Basic: 2 Medium', which is more than sufficient for the load we put on it. The CPU and Memory charts show that the system is largely sleeping with memory usage being around 36%.
As we paid good attention in server school, we actively monitor the various layers of the overall solution using Azure's standard monitoring facilities. One of the counters we keep track of is the 'Disk Queue length', it is one of the very few counters available on Azure App Services so it must be important.
Back in server school we were told that the disk queue length should ideally be zero and if it is persistently above 1, you need to get your act together (There are some exceptions for certain RAID configurations). Over the last few years all was well, the disk queue length was zero 99% of the time with the occasional spike to 5 when Microsoft was servicing the system.
A couple of months ago things started to change out of the blue (so not after we rolled out changes). Disk queue alerts started flooding in and the average queue length is in the 30s.
We let it run for a few days to see if the problem would go away (performance is not noticeably impacted, at least not under the current load). As the problem did not go away we thought that perhaps the underlying system had a problem so we instantiated a brand new Azure App Service and migrated to that one. Same problem.
So we reached out to Azure support. Naturally they asked us to run a number of nonsense tests in the hope we would go away (they asked for network traces... for a disk queue problem!). We don't give up so easily, so we ran their nonsense tests and eventually were told to just set the alert for the queue length to 50 (over 10 minutes).
Although we have no control over the underlying hardware, infrastructure and system configuration, this just does not sound right.
Their full response is as follows
I reached out to our product team with the information gathered in this case.
They investigated the issues where the alert you have specified for Disk Queue Length is firing more frequently than expected.
This alert is set to notify you if the Disk Queue Length average exceeded 10 over 5 minutes. This metric is the average number of both read and write requests that were queued for the selected disk during the sample interval. For the Azure App Service Infrastructure this metric is discussed in the following documentation link: https://docs.microsoft.com/en-us/azure/app-service-web/web-sites-monitor
The value of 10 is very low for any type of application deployed and so you may be seeing false positives. This means the alert might trigger more frequently than the exact number of connections.
For example on each virtual machine we run an Anti-Malware Service to protect the Azure App Service infrastructure. During these times you will see connections made and if the alert is set to a low number it can be triggered.
We did not identify any instance of this Anti-Malware scanning affecting your site availability. Microsoft recommends that you consider increasing the Disk Queue Length metric be set to an average value of at least 50 over 10 minutes.
We believe this value should allow you to continue to monitor your application for performance purposes. It should also be less affected by the Anti-Malware scanning or other connections we run for maintenance purposes.
Anyone wants to chime in?
