0

I am trying to use Prometheus snmp_exporter to gather metrics for Cisco switches and use Grafana repeated panels for displaying. the Grafana works magically well. However, I have difficulity to assign the title automatically on each panel based on the interface.

Sample of Prometheus data:

ifDescr{ifDescr="GigabitEthernet1/0/12",ifIndex="10112"} 1
ifDescr{ifDescr="GigabitEthernet1/0/13",ifIndex="10113"} 1
...
ifHCInOctets{ifIndex="10112"} 1.03615731929e+11
ifHCInOctets{ifIndex="10113"} 2.644180651e+09

Since all metrics are referenced with ifIndex, I managed to irate the rows by ifIndex. However, the title doesn't change along with the ifIndex. Please find the screenshot for your information:

Switch Interface I/O Grafana template variables

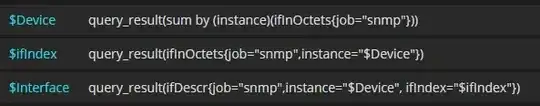
Please anyone could ignite me about how to change title automatically along with the metric? Thanks!

Thomas
  • 4,155
  • 5
  • 21
  • 28
Roger
  • 91
  • 1
  • 3
  • 8

2 Answers2

1

it is long and hard study for prometheus. endup I solved the issue with the prometheus query.

there is no way to run query for each row/panel in repeated row/panel, at least in the current version of Grafana. all variables are caculated once when dashboard loads. It would be nice if the dependant variables could be caculated for each row/panel for repeated one, e.g. the $Interface when the rows are repeated on $ifIndex.

Roger
  • 91
  • 1
  • 3
  • 8
0

In the title , you can use a variable to differentiate yours titles, ex in your case : $interface or $ifindex

Sorcha
  • 1,315
  • 8
  • 11
  • No, it doesn't work. I have put $Interface in title and $ifIndex in metric. The result is showing as the screenshot above. all panels has the same title. I am suspecting that the query will only run once when the dashboard is loaded. – Roger Sep 08 '17 at 07:25