Often, an installation of our on-site, debian-stable based application runs in a virtual machine - typically in VMware ESXi. In the general case we do not have visibility into or influence over their virtualization environment and do not have access to e.g. the VMware vCenter client or equivalent. I focus on VMware here, because that by far is the most common we see.
We'd like to:
- Tell a customer's VMware admin: You can run our application in e.g. your VMware ESX environment, as long as it meets performance criteria X, Y and Z.
- Be able to determine if criteria X, Y and Z are in fact met continuously (e.g. also right now), even on a running system (we cannot stop our application and run benchmarks, and an initial benchmark won't suffice, since performance in virtual environments changes over time).
- Have confidence that if criteria X, Y and Z are met, we will have adequate virtual HW resources to run our application with satisfactory performance.
Now what are X, Y and Z?
We have seen time and again, that when there are performance problems, the problem isn't with our application, but with the virtualization environment. E.g. another virtual machine uses tons of CPU, memory or the SAN on which the disks are actually stored get heavy use by something other than our application. We currently have no way to prove or disprove that.
Theoretically it could also be possible that sometimes our application is slow... ;-)
How does one determine the root cause of our performance problems: Virtual environment or our application?
There are typically 3 areas for performance problems CPU, Memory and DISK I/O.
CPU
In e.g. VMware the administrator can specify Reservation and Limit, expressed in MHz, but is e.g. 512MHz on one ESX host exactly the same as 512MHz on another ESX host, possibly in a completely different ESX cluster?
And how does one measure whether we actually get that? While our application is running, we can perhaps see that we are at 212% CPU utilization on 4 CPUs. Is that because our application is doing a lot or because another VM on the same host is running a CPU intensive task and using all the CPU?
Memory (Ballooning?)
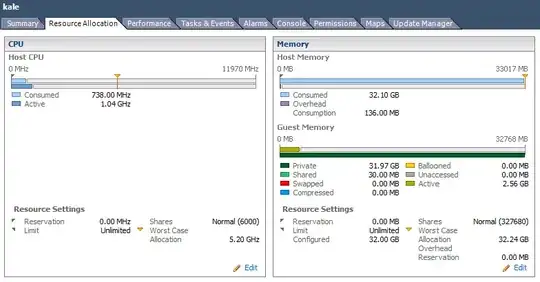
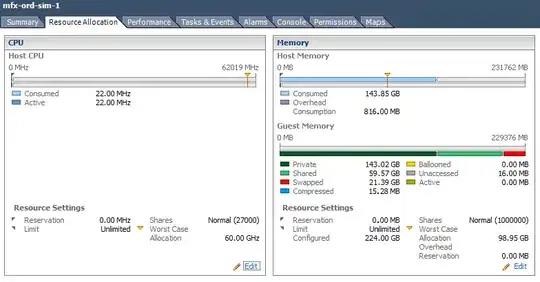
If we ask for e.g. 16GB RAM, that is often configured, but because of ballooning, we actually only get 4GB, and surprise, our application performs poorly.
One can ask the VMware tools about the current ballooning, but we've find that it often lies (or is inaccurate at least). We've seen examples where the OS thinks there is 16GB total RAM, the sum of the resident memory (RSS) of all processes is 4GB RAM, but there is only 2GB RAM free, even when VMware tools tells us there is 0 ballooning :-(
Also, just adding RSS together isn't valid, as there could easily be shared RAM, e.g. copy-on-write memory so 512MB + 512MB doesn't necessarily mean 1GB but could mean something less. So one can't simply subtract RSS from all processes to get a measure for how much RAM should be free and thereby detect ballooning reliably. One can detect some cases of ballooning, but there are other cases where ballooning is in effect, but not detectable by this method.
Disk I/O
I guess we could graph over time the number of disk reads and writes, the number of bytes read and written, and the IO wait %. But will that give us an accurate picture of disk I/O? I imagine that if there is a bitcoin miner running in another VM using all the CPU, our IO wait % will go up, even if the underlying SAN gives exactly the same performance, simply because our CPU resources go down, and hence IO wait (which is measured in %) goes up.
So in summary, what language can we use to describe to e.g. a VMware admin, what performance we need, in a portable and measurable way?


