I have a webserver with Windows 2012 R2, running only one website, on ASP.NET 4.5.1, IIS 8.5. It does not have, and has never had, the AD role installed.
Last Sunday, the process lsass.exe, suddenly started using 20-40% CPU. We did not change anything on the server, or in the surrounding network. (No windows update happened at this point)
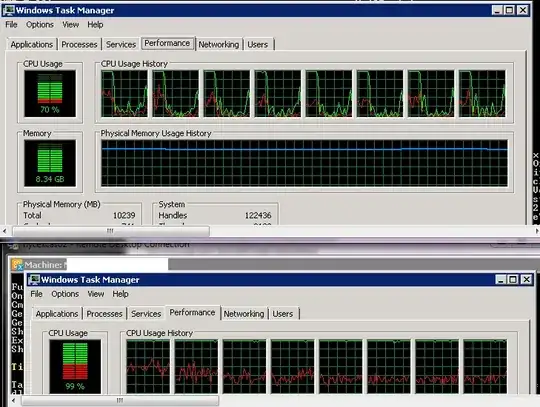
Since then, the website gradually deteriorates, having longer and longer response times, until the server is rebooted, then everything is back to normal, but it slowly goes downhill from there. The server now has to be rebooted every 4-12h, in order to keep the site up and running. The CPU usage on the server never reaches 100%, and there is also spare RAM available.
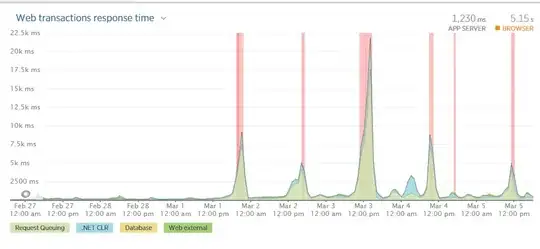
From New Relic, which is used to monitor the site and server, it looks like it is Request Queueing that is causing the poor performance, increasing from ~100ms after a reboot, to 10s+ after a few hours.
I have other servers, with the same website code, running in the same environment, with more load than this one, which do not show this behaviour. (Though they are on WS 2012 (not R2))
I have monitored network traffic, and see nothing strange there. The one thing that does stand out, and seem correlated, in Perfmon, is "Security per process statistics\Credential Handles", which keeps increasing for the lsass process, it starts at only a handful after reboot, and reaches 100.000+ after a few hours in operations. No other process is doing this, and lsass.exe on other servers, only have a few hundred "Credential Handles"
See graph over lsass.exe process over the last month:

Graph of website response times, from New relic. Each peak demanded a reboot, server was also rebooted on smaller peaks, not very visible on this chart:

Any advice on what might be wrong, and how to fix?
Edit:
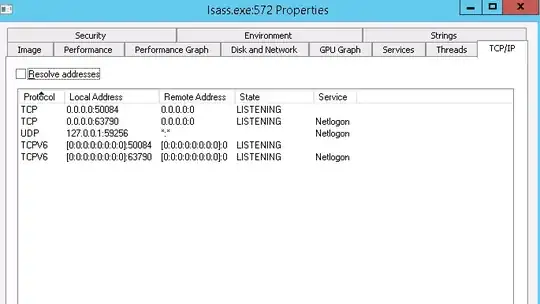
Snapshot of TCP/IP panel of Process Explorer on lsass.exe

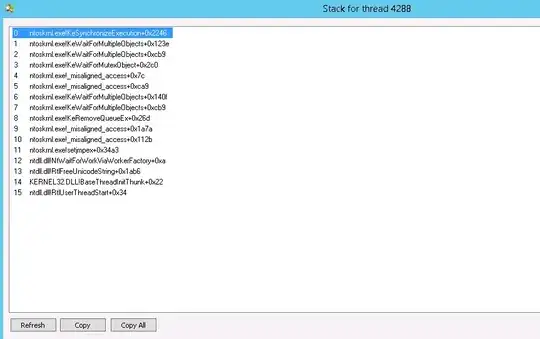
Snapshot of a typical thread spawned from lsass.exe, these pop up about every second in Process Explorer:
