1

This is my graph of HDD avgqu-sz from different app machines: avgqu-sz 
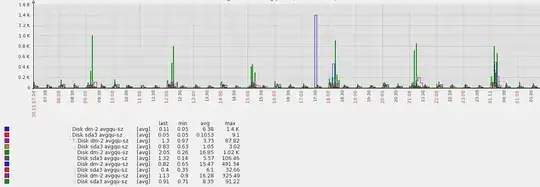
App caches data in memory and every n minutes are data flushed to filesystem + every m minutes are data (re)loaded from filesystem in memory. That's the reason of the spikes. Block devices utilization during these spikes is 80-95%.

Q: Do I need to worry about my disks performance? How to interpret this graph - is OK or not OK? Do I need to optimize something?

  • Yes, I have pretty high spikes ~1k, but then queue size is ~1 => one day avg is ~16 - I don't know If I can be happy with this avg value
  • Yes, I know what metric avgqu-sz means
  • Yes, I've optimized my filesystems for high IOps (noatime, nodirtime)
the-wabbit
  • 40,319
  • 13
  • 105
  • 169
Jan Garaj
  • 869
  • 1
  • 7
  • 15
  • It's `avgqu-sz` - for "average queue size". It also says so in your graph, although I can see how easy it is to mistake a "q" for a "g" with some fonts. – the-wabbit Dec 04 '14 at 19:01

2 Answers2

1

Yes, I know what metric avggu-sz means That means you know that generally data flows like this

     app --> bio layer --> I/O Scheduler --> Driver --> Disks
                           nr_requests                  queue_depth

This is just a general overview and not covering everything.As long as nr_requests remains the queue_Depth,I/O will pass quickly.The issue starting arising when these requests exceeding the queue depth and the I/O start helding in scheduler layer.

Looking at your graphs I would highly suggest 1: check the disk having high peaks 2: Try to change the value of nr_requests and queue_depth to see if it helps 3: Change the scheduler in your test environment(as your data here doesn't contain merge request(read/write)..so I cant comment)

                /sys/block/<your disk drive sda,sdb...>/queue/nr_requests (io scheduler)
                /sys/block/<your disk drive sda,sdb...>/device/queue_depth (driver)
Prashant Lakhera
  • 683
  • 1
  • 9
  • 25
  • Thx for comment Prashant. Here is my graph of HDD rrqm/s (bad label on the graph rwrqm/s) wrqm/s r/s w/s http://i.imgur.com/iHgXPWa.png from different app machines. My disk values queue_depth: 32, nr_requests: 128, scheduler: noop anticipatory deadline [cfq]. I'l try to tweak these values. Any recommendations. – Jan Garaj Dec 04 '14 at 19:25
0

An average queue size of more than 1,000 requests is trouble unless you are running an array with hundreds of disks exposed as a single device.

From your graph however I would argue that most of your spikes are either measurement or graphing artefacts - your data looks like it is being collected in 5-minute intervals, yet the spikes do have a width of basically zero - very unusual. You should take a look at the raw data as collected by sar or displayed by iostat in near-realtime to rule that out. If you still see queue sizes of more than 30 requests per spindle used, check back here with the data.

the-wabbit
  • 40,319
  • 13
  • 105
  • 169
  • Yes, data are collected every 5 minutes, but collection period is also 5 minute (So I collect output, which is similar to iostat -xd 300 10). Only the busiest machine has 1 minute collection period. – Jan Garaj Dec 04 '14 at 19:33