I've just finished reading this old Q&A which had some really good detailed information on a similar setup to ours, though unfortunately our problem (now) is not with replication.
We have a new master database server (Server version: 5.5.27-log MySQL Community Server) that is on a bare metal server with the following specs:
- 2 x Intel E5-2620-v2
- 64Gb Memory
- 2 x Fusion-io 600Gb card (Raid 1) for MySql
- 1 x SSD for Centos 6.5
- 1Gbps Network
HyperThreading has not been disabled on the server as there is mixed opinions about whether this helps on large memory systems, but we're not against trying it.
We currently replicate to 3 slaves that are virtualised on a SSD cluster. We were replicating to 4 but this seemed too much for the SSD cluster and we had periods of lag.
All tables are InnoDB and master DB and slave Writes are between 3.5K - 2.5K qps, whilst Reads on the master are about 7.5k - 10k qps.
The settings for the master DB are as follows:
long-query-time=10
slow-query-log

max_connections=500
max_tmp_tables=1024

key_buffer = 1024M
max_allowed_packet = 32M

net_read_timeout=180
net_write_timeout=180

table_cache = 512

thread_cache = 32
thread_concurrency = 4

query_cache_type = 0
query_cache_size = 0M

innodb_file_per_table
innodb_file_format=barracuda

innodb_buffer_pool_size=49152M
innodb_buffer_pool_instances=2
innodb_read_io_threads=16
innodb_write_io_threads=16
innodb_io_capacity = 500

innodb_additional_mem_pool_size=20M
innodb_log_file_size=1024M
innodb_log_files_in_group = 2

innodb_doublewrite=0
innodb_flush_log_at_trx_commit=2
innodb_flush_method=O_DIRECT
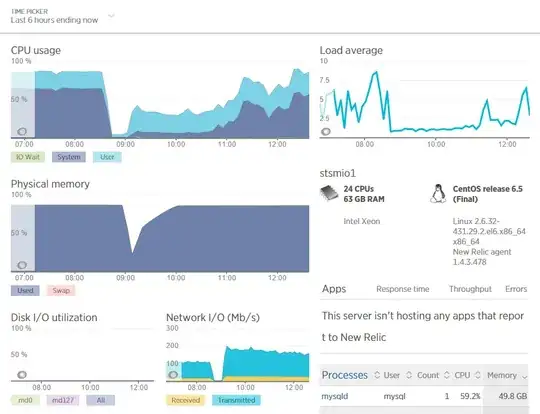
Our problem is with CPU load, especially Sys Cpu. As you can see from mpstat we have 0% iowait and very high %sys.
Linux 2.6.32-431.29.2.el6.x86_64            13/11/14    _x86_64_    (24 CPU)

13:57:18     CPU    %usr   %nice    %sys %iowait    %irq   %soft  %steal  %guest   %idle
13:57:19     all   23.35    0.00   74.65    0.00    0.00    0.88    0.00    0.00    1.13
13:57:20     all   21.95    0.00   75.50    0.00    0.00    0.96    0.00    0.00    1.59
13:57:21     all   23.74    0.00   72.63    0.00    0.00    1.00    0.00    0.00    2.63
13:57:22     all   23.88    0.00   71.64    0.00    0.00    1.17    0.00    0.00    3.31
13:57:23     all   23.26    0.00   73.89    0.00    0.00    0.92    0.00    0.00    1.92
13:57:24     all   22.87    0.00   74.87    0.00    0.00    1.00    0.00    0.00    1.25
13:57:25     all   23.41    0.00   74.51    0.00    0.00    0.96    0.00    0.00    1.12
Previously the master database was running on a virtualised server (same SSD cluster as the slaves). It had a host to itself within the vSphere cluster which had:
- 2 x Intel X5570
- 32Gb of memory
- SSD shared from cluster
There was never any problem before, the server ran without fault for many years, albeit with lower SQL throughput.
Queries are all simple and indexes have been optimized for inserts & updates as complex client queries are carried out on the slaves. There are no deletes, only inserts & updates. Most tables (all big ones) have primary keys.
The CPU usage seems to grow once the memory buffer is full, and MySql is the only application being run on the server.
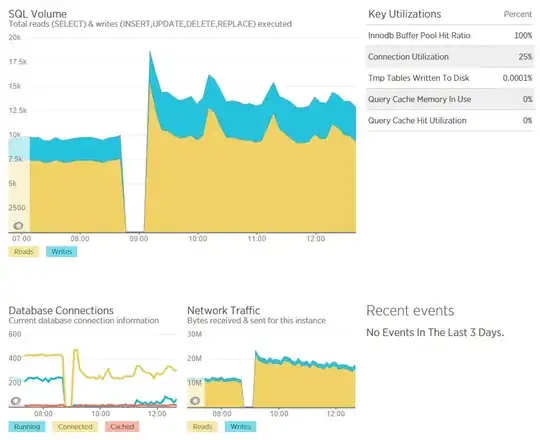
Connections range from about 200-400 with around 100-200 of those running. Innodb Buffer Pool Hit Ratio is 100%. There's no swap memory ever being created so I cannot see this being the issue:
http://blog.jcole.us/2010/09/28/mysql-swap-insanity-and-the-numa-architecture/
We have a ton of history with New Relic but unfortunately I cannot paste in screenshots here.
I've gone through countless blogs and Q&As like this but cannot find any cause nor solution so am putting it out there.. Any ideas?
UPDATE
It seems I can now post screenshots. These two captures from New relic show the system load and query load on the server over a 6 hour window with a restart of mysql in the middle.

