1

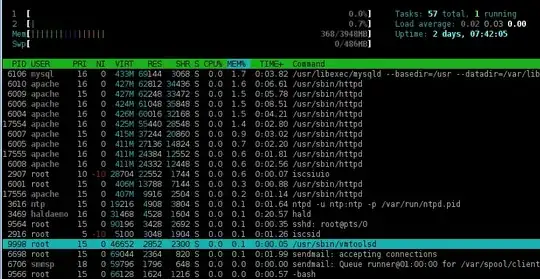
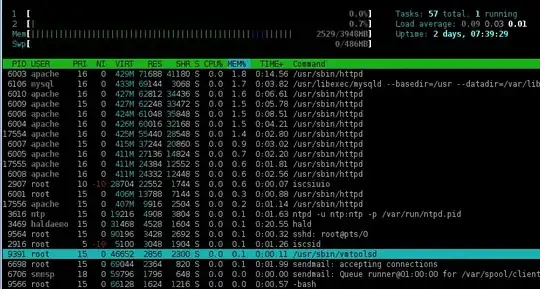
I am experiencing a problem where htop (top too) is incorrectly reporting the memory consumption of a process, in this case the vmware-tools service (highlighted below). I am colorblind and thought I might be mistaking used memory for cache, so I had someone else confirm it. In the screenshot it was only at 2529 MB, but it will continue to grow until all memory is consumed and the system becomes unstable. I tried re-installing vmware-tools but the issue persisted. It doesn't seem to be happening on any other VM. I have 2 questions: why is the memory consumption for vmtoolsd only listed at 0.1% when it is obviously much more than that, and how do I correct the problem?

I received an error message saying that new users can't post images, so I will link to them instead:

Before restarting vmware-tools:

http://i.stack.imgur.com/huMRe.png

After restarting vmware-tools:

http://i.stack.imgur.com/fx83Q.png

Michael Hampton
  • 237,123
  • 42
  • 477
  • 940
Tag
  • 113
  • 5
  • 1
    Sounds like ballooning. How much of the host's memory is used? What's the balloon number on the VM's memory statistics in the vSphere client? – Shane Madden Feb 04 '13 at 06:17

1 Answers1

2

This is a known issue with ESX 4.

Virtual machines display increased memory usage in vmware-guestd and vmwareservice.exe. The memory footprint of the process continues to increase until the available memory is drained and the process cannot allocate any memory. This issue is more prominent when the guest operating system has a large number of IP addresses associated with it.

VMware has released a patch which fixes the issue. After updating ESX 4, you must update VMware Tools in the virtual machine as well.

Michael Hampton
  • 237,123
  • 42
  • 477
  • 940