5

I'm using graphite version 0.9.10 to read ifHCInOctets and ifHCOutOctets, which I'm polling with the collectd snmp and graphite_write plugins; I'm using collectd version 5.1.0.

Data arrives into graphite with no problems; however, I want to graph as bits-per-second. To test whether my stats are correct, I started a CD iso download and watched the download rate... it varied between 1.0Mbps and 2.0Mbps.

Common-sense tells you that you need to multiply Octets counters by 8 to get bits; however, it seems that I need to divide by 8 to make graphite display correctly.

When I multiply by a 0.125 scale factor, scale(scaleToSeconds(nonNegativeDerivative(<SERIES>), 60),0.125), the formula correctly converts to bits-per-second and I see numbers between 1Mpbs and 2Mbps...
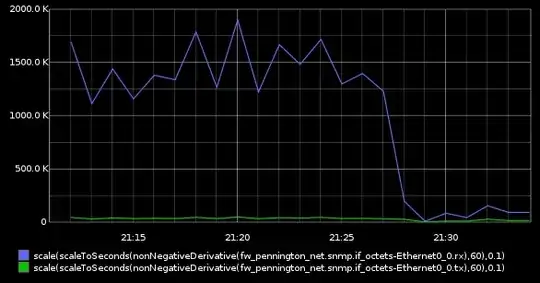
Correct scale - 0.125

When I multiply by a 8.0 scale factor, scale(scaleToSeconds(nonNegativeDerivative(<SERIES>), 60),8), the results are obviously wrong... the graph peaks at 120Mbps. I know that's wrong, because this is a residential cable modem with a 5M cap.
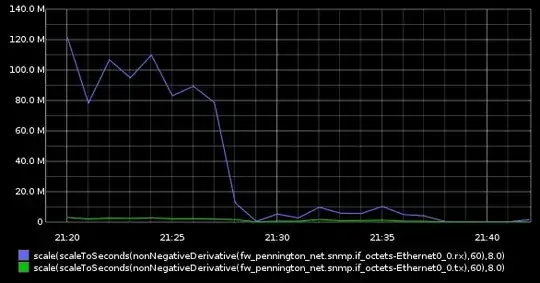
Wrong scale

Question: If I'm sending octets to graphite, why is scale(<foo>, 8) producing incorrect results?


/opt/collectd/etc/collectd.conf

LoadPlugin syslog 
LoadPlugin cpu
LoadPlugin interface
LoadPlugin load
LoadPlugin memory
LoadPlugin network
LoadPlugin snmp
LoadPlugin write_graphite

<Plugin snmp>
   <Data "std_traffic">
       Type "if_octets"
       Table true
       Instance "IF-MIB::ifName"
       Values "IF-MIB::ifHCInOctets" "IF-MIB::ifHCOutOctets"
   </Data>

   <Host "fw.pennington.net">
       Address "172.16.1.1"
       Version 2
       Community "public"
       Collect "std_traffic"
       Interval 60
   </Host>
</Plugin>

<Plugin write_graphite>
  <Carbon>
    Host "localhost"
    Port "2003"
    Prefix ""
    Postfix ""
    StoreRates false
    AlwaysAppendDS false
    EscapeCharacter "_"
  </Carbon>
</Plugin>

/opt/graphite/conf/storage-schema.conf:

[carbon]
pattern = ^carbon\.
retentions = 60s:90d

[default]
pattern = .*
retentions = 60s:1w, 5m:1y

/opt/graphite/conf/carbon.conf:

[cache]

USER = carbon

MAX_CACHE_SIZE = inf

MAX_UPDATES_PER_SECOND = 500

MAX_CREATES_PER_MINUTE = 50

LINE_RECEIVER_INTERFACE = 0.0.0.0
LINE_RECEIVER_PORT = 2003

ENABLE_UDP_LISTENER = False
UDP_RECEIVER_INTERFACE = 0.0.0.0
UDP_RECEIVER_PORT = 2003

PICKLE_RECEIVER_INTERFACE = 0.0.0.0
PICKLE_RECEIVER_PORT = 2004

USE_INSECURE_UNPICKLER = False

CACHE_QUERY_INTERFACE = 0.0.0.0
CACHE_QUERY_PORT = 7002

USE_FLOW_CONTROL = True

LOG_UPDATES = False

WHISPER_AUTOFLUSH = False

[relay]
LINE_RECEIVER_INTERFACE = 0.0.0.0
LINE_RECEIVER_PORT = 2013
PICKLE_RECEIVER_INTERFACE = 0.0.0.0
PICKLE_RECEIVER_PORT = 2014

RELAY_METHOD = rules

REPLICATION_FACTOR = 1

DESTINATIONS = 127.0.0.1:2004

MAX_DATAPOINTS_PER_MESSAGE = 500
MAX_QUEUE_SIZE = 10000

USE_FLOW_CONTROL = True

[aggregator]
LINE_RECEIVER_INTERFACE = 0.0.0.0
LINE_RECEIVER_PORT = 2023

PICKLE_RECEIVER_INTERFACE = 0.0.0.0
PICKLE_RECEIVER_PORT = 2024

DESTINATIONS = 127.0.0.1:2004

REPLICATION_FACTOR = 1

MAX_QUEUE_SIZE = 10000

USE_FLOW_CONTROL = True

MAX_DATAPOINTS_PER_MESSAGE = 500

MAX_AGGREGATION_INTERVALS = 5

Output from whisper-fetch.py

root@tsunami:/opt/graphite/conf# python /usr/local/bin/whisper-fetch.py --pretty /opt/graphite/storage/whisper/fw_pennington_net/snmp/if_octets-Ethernet0_0/rx.wsp
Mon Sep 10 02:53:00 2012        110454375894.000000
...
Tue Sep 11 02:50:00 2012        110532796093.000000
Tue Sep 11 02:51:00 2012        110532819931.000000 <------------ Correct
Tue Sep 11 02:52:00 2012        None
root@tsunami:/opt/graphite/conf#

Output from show interface eth0/0

mpenning-fw# sh int eth0/0
Interface Ethernet0/0 "", is up, line protocol is up
  Hardware is 88E6095, BW 100 Mbps, DLY 100 usec
        Auto-Duplex(Full-duplex), Auto-Speed(100 Mbps)
        Description: TIME WARNER 5Mbps circuit
        Available but not configured via nameif
        MAC address 0019.0726.4a39, MTU not set
        IP address unassigned
        157040376 packets input, 110532814004 bytes, 0 no buffer
                                 ^^^^^^^^^^^^^^^^^^
        Received 68921847 broadcasts, 0 runts, 0 giants
        0 input errors, 0 CRC, 0 frame, 0 overrun, 0 ignored, 0 abort
        0 L2 decode drops
        8589974681 switch ingress policy drops
        57851429 packets output, 8036229250 bytes, 0 underruns
        0 output errors, 0 collisions, 0 interface resets
        0 babbles, 0 late collisions, 0 deferred
        0 lost carrier, 0 no carrier
        0 rate limit drops
        0 switch egress policy drops
mpenning-fw#
Mike Pennington
  • 8,266
  • 9
  • 41
  • 86

3 Answers3

5

If you want bits per second you'll need to specify 1 instead of 60 as second argument to the scaleToSeconds() function, as you want per second, not per minute. (Mnemonic: it's to seconds, not from seconds :)

Here is the original patch that implemented the function; it may clarify.

Niels
  • 176
  • 3
1

I spent hours trying to get this to work properly in Grafana v2.6 and could not find the right solution. So here it is:

  1. Make sure you have the right Storage Aggregation defined in /etc/carbon/storage-aggregation.conf

I have all my Network Devices prefixed with net

[net] pattern = ^net.* retentions = 10s:7d,5m:180d,5m:5y

  1. Create /etc/collectd/collectd.conf.d/snmp.conf and add the following:

    FQDNLookup true
    AutoLoadPlugin true
    Interval 10
    LoadPlugin syslog
    <Plugin syslog>
      LogLevel info
    </Plugin>
    
    LoadPlugin contextswitch
    LoadPlugin cpu
    LoadPlugin df
    LoadPlugin entropy
    
    LoadPlugin interface
    LoadPlugin irq
    LoadPlugin load
    LoadPlugin memory
    LoadPlugin processes
    #LoadPlugin sensors
    LoadPlugin swap
    LoadPlugin unixsock
    LoadPlugin users
    LoadPlugin write_graphite
    
    <Plugin write_graphite>
      <Node "stats">
        Host "stats.foo.com"
        Port "2003"
        Protocol "tcp"
        LogSendErrors true
        Prefix "net."
        SeparateInstances true
        StoreRates true
        AlwaysAppendDS false
        EscapeCharacter "_"
      </Node>
    </Plugin>
    
    <Plugin unixsock>
      SocketFile "/var/run/collectd-unixsock"
      SocketGroup "adm"
      SocketPerms "0660"
    </Plugin>
    
    <Plugin df>
      # ignore rootfs; else, the root file-system would appear twice, causing
      # one of the updates to fail and spam the log
      FSType rootfs
      # ignore the usual virtual / temporary file-systems
      FSType sysfs
      FSType proc
      FSType devtmpfs
      FSType devpts
      FSType tmpfs
      FSType fusectl
      FSType cgroup
      IgnoreSelected true
    </Plugin>
    
    # added a special types.db for cisco devices
    TypesDB "/usr/share/collectd/types.db" "/usr/share/collectd/types.custom.db"
    
    LoadPlugin snmp
    <Plugin snmp>
      # the <Data> name is what to <Collect> down in the <Host> blocks
      # the "Type" must be from the list included in /usr/share/collectd/types.db (or custom.db)
      <Data "if_octets">
        Type "if_octets"
        Table true
        # Note: I use ifAlias so that it shows the Interface Descriptions instead just "GigabitEthernet_1_0_0, etc. But of course, make sure you have interface descriptions if you use this :)
        Instance "IF-MIB::ifAlias"
        Values "IF-MIB::ifHCInOctets" "IF-MIB::ifHCOutOctets"
      </Data>
      <Data "if_errors">
        Type "if_errors"
        Table true
        Instance "IF-MIB::ifAlias"
        Values "IF-MIB::ifInErrors" "IF-MIB::ifOutErrors"
      </Data>
      <Data "cisco_cpu">
        Type "cisco_cpu"
        Table true
        Values "CISCO-PROCESS-MIB::cpmCPUTotal5secRev" "CISCO-PROCESS-MIB::cpmCPUTotal1minRev" "CISCO-PROCESS-MIB::cpmCPUTotal5minRev"
      </Data>
      <Data "uptime">
        Type "uptime"
        Table false
        Instance "Uptime"
        scale 0.01
        Values  "DISMAN-EVENT-MIB::sysUpTimeInstance"
      </Data>
      <Data "memory_free">
        Type "memory_free"
        Table true
        Instance "CISCO-MEMORY-POOL-MIB::ciscoMemoryPoolName"
        Values  "CISCO-MEMORY-POOL-MIB::ciscoMemoryPoolFree"
      </Data>
      <Data "memory_used">
        Type "memory_used"
        Table true
        Instance "CISCO-MEMORY-POOL-MIB::ciscoMemoryPoolName"
        Values "CISCO-MEMORY-POOL-MIB::ciscoMemoryPoolUsed"
      </Data>
    
      # Hosts:
      <Host "rtr">
        Address "192.168.1.1"
        Version 2
        Community "public"
        Collect "if_octets" "cisco_cpu" "uptime"
        Interval 10
      </Host>
      <Host "switch">
        Address "192.168.1.254"
        Version 2 
        Community "public"
        Collect "if_octets" "cisco_cpu" "uptime"
        Interval 10
      </Host>
    </Plugin>
    

Here's the custom.db: (I don't recall where I got the original, but thanks to that dude!)

if_stats                ifHCInOctets:COUNTER:0:U, ifHCOutOctets:COUNTER:0:U, ifHCInUcastPkts:COUNTER:0:U, ifHCInMulticastPkts:COUNTER:0:U, ifHCInBroadcastPkts:COUNTER:0:U, ifHCOutUcastPkts:COUNTER:0:U, ifHCOutMulticastPkts:COUNTER:0:U, ifHCOutBroadcastPkts:COUNTER:0:U, ifInDiscards:COUNTER:0:U, ifInErrors:COUNTER:0:U, ifOutDiscards:COUNTER:0:U, ifOutErrors:COUNTER:0:U
if_octets_hc     ifHCInOctets:COUNTER:0:U, ifHCOutOctets:COUNTER:0:U
if_packets_hc                   ifHCInUcastPkts:COUNTER:0:U, ifHCInMcastPkts:COUNTER:0:U, ifHCInBcastPkts:COUNTER:0:U, ifHCOutUcastPkts:COUNTER:0:U, ifHCOutMcastPkts:COUNTER:0:U, ifHCOutBcastPkts:COUNTER:0:U
if_drop_discard_err_que         ifInDiscards:COUNTER:0:U, ifInErrors:COUNTER:0:U, ifOutDiscards:COUNTER:0:U, ifOutErrors:COUNTER:0:U
if_rgpackets                   ifInUcastPkts:COUNTER:0:U, ifInNUcastPkts:COUNTER:0:U, ifOutUcastPkts:COUNTER:0:U, ifOutNUcastPkts:COUNTER:0:U
sensors                      sensorValue:GAUGE:U:U, sensorThreshold:GAUGE:U:U
uptime                  uptime:GAUGE:U:U
cisco_cpu       cpu5sec:GAUGE:0:100, cpu1min:GAUGE:0:100, cpu5min:GAUGE:0:100
routes  ipv4routes:GAUGE:0:U, ipv6routes:GAUGE:0:U, mcastroutes:GAUGE:0:U
ipsla   rttAdmNumDistBkt:GAUGE:0:200, rttAdmDistInt:GAUGE:0:200, rttTotalsInit:COUNTER:0:U, rttCollectDrops:COUNTER:0:U, rttCollectTimeouts:COUNTER:0:U, rttCptComplTimeMn:GAUGE:0:100000, rttCptComplTimeMx:GAUGE:0:100000, rttCptSumCmpTm2Hi:COUNTER:0:U, rttCptSumCmpTm2Lo:COUNTER:0:U, rttCptSumCmpTm:COUNTER:0:U, rttCptOverThres:COUNTER:0:U
ipslaminimal   rttCptCompletions:COUNTER:0:U
ipsla2  rttCollectTimeouts:COUNTER:0:U

If anyone has the correct configuration (and types.custom.db) to track other Cisco metrics such as Power Supply, Duplex, Fans, (ESPECIALLY) NBAR, etc. Please share!

In Grafana, configure the graph like so:

alias(scale(scaleToSeconds(net.rtr.snmp.if_octets.RTR-Outside-Gi0_0.rx, 0.125), 3600), 'Download')

You'll need to replace net.rtr.snmp.if_octets.RTR-Outside-Gi0_0 with your device name and ifAlias

Clayton Dukes
  • 444
  • 2
  • 9
0

I'm running Graphite 0.9.9 and scaleToSeconds is not available for me. To get around the problem you need to understand the metric in detail... Take my example:

1000baseT interface utlization graph

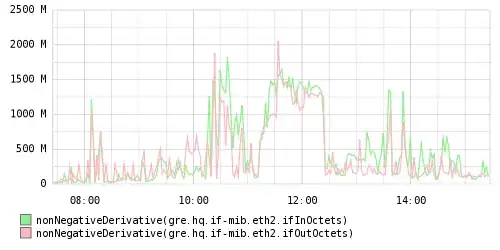
The Y value is in Millions and not Mbps. You can verify that by setting yUnitSystem=none in your graph URL. Secondly, an Octet is 8 bits of data which is a byte. My peak of 2000000000 bytes (octets) is a per minute metric so to make more sense of it lets do math:

2000000000B/60s ≈ 33333333B/s ≈ 32 Megabytes/s ≈ 254 Megabits/s

254 Mbps on my Gigabit ethernet (1000 Mbps) interface is well within its capability. I hope this helps.

AXE Labs
  • 1,519
  • 5
  • 19
  • 24
  • There is a small difference between an octet and a byte. See: http://whatis.techtarget.com/definition/octet – AXE Labs Jan 14 '14 at 21:07