I want to graph (graphical output would be great, i.e. a .png file) the following situation: I have users A, B, and C. I limit their resources so that when all users run a CPU intensive task at the same time, those processes will use 25%, 25%, and 50% of CPU. I know I can get the real-time stats using top but have no idea what to do with them. I've searched through the huge top man page but haven't found much on the subject of outputting data that can be graphed. Ideally, the graph would show a span of maybe 30 seconds. Any ideas how to achieve this?
Asked
Active
Viewed 1.1k times
7
mart1n
- 175
- 2
- 2
- 7
-
Flagged. Though, just collecting the raw data somehow would be great. I know you can do it with `virt-top` (something like `virt-top -d $DELAY --csv $CSVFILE --script`) but haven't found the equivalent for `top` – mart1n Jun 05 '12 at 15:54
4 Answers
7
The tload command represents the pictorial representation of the average system load through ASCII graph. This command can be used to provide the graph on a terminal. The syntax for the command is:
tload [options] [terminal]
If terminal is not provided as the argument to this command, then by default it outputs the graph on the current terminal. So the simplest forms of this command are:
$ tload
pabloab
- 71
- 1
- 1
4
I know I can get the real-time stats using top but have no idea what to do with them
Batch mode could be useful:
   -b : Batch mode operation
        Starts  top  in ’Batch mode’, which could be useful for sending output from top to other programs or
        to a file.  In this mode, top will not accept input and runs until the iterations limit  you’ve  set
        with the ’-n’ command-line option or until killed.
For example:
$ top -b -n 1 -u <user> | awk 'NR > 7 { sum += $9 } END { print sum }'
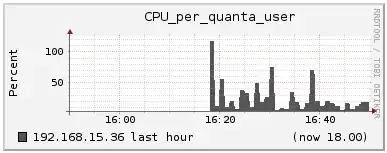
Ganglia Gmetric can be used to plot a graph for this.
cpu_per_user_gmetric.sh
#!/bin/bash
USERS="a b c"

for user in $USERS; do
    /usr/bin/gmetric --name CPU_per_"$user"_user --value `top -b -n 1 -u $user | awk 'NR>7 { sum += $9; } END { print sum; }'` --type uint8 --unit Percent
done
crontab -l
* * * * * /path/to/cpu_per_user_gmetric.sh
and here's the result:
quanta
- 50,327
- 19
- 152
- 213
2
Perhaps you could use collectd and adapt one of the available plugins? Yes, none of the listed will do exactly what you want, but on the other hand they are pretty simple to modify and I think you could start with for example processes plugin and start working from there.
Janne Pikkarainen
- 31,454
- 4
- 56
- 78
1
Try sar and sadf to gather and prepare the data for easy graphing. http://sebastien.godard.pagesperso-orange.fr/documentation.html
Jeremy
- 938
- 2
- 7
- 18
-
I did check out `sar` but could not find a way to associate a process with a specific user, any ideas? – mart1n Jun 06 '12 at 14:13