2

I was trying to mimic this logstash.net/docs/1.1.0/tutorials/metrics-from-logs

I have following setup

nginx(app server) ==sends the increment==>Etsy statsD=====>Graphite

This setup is working fine since graph is being plotted just fine but not correctly. According to above configuration, I understand the graph step value should be integer but I am getting floating points numbers in Y axis(hits) as per the attached graph and I am completely baffled as to how do i interpret this graph.

Logstash agent configuration

input {
  file {
    type => nginx_web
    path => ["/var/log/nginx/access.log"]
  }

filter {
 grok {
   type => nginx_web
   pattern => "%{IP:ClientIP} (?:%{HOST:ClientHost}|-) (?:%{USER:ClientUser}|-) \[%{GREEDYDATA:TimeStamp}\] \"(?:%{WORD:Verb} %{URIPATHPARAM:Request} HTTP/%{NUMBER:HTTPversion}|%{DATA:UnparsedRQ})\" %{NUMBER:Response} (?:%{NUMBER:Bytes}|0) (?:%{QUOTEDSTRING:HTTPReferrer|\"-\"}) %{QUOTEDSTRING:HTTPUserAgent}"
 }

output {

 statsd {
        type => "nginx_web"
        host => "X.X.X.X"
        increment => [
                        "nginx.response.%{Response}"
                     ]
    }
}

I am using following URL API to generate this graph

render/?width=600&height=320&hideLegend=1&from=-60minutes&until=-0minutes&target=stats.logstash.*.nginx_web.response.*
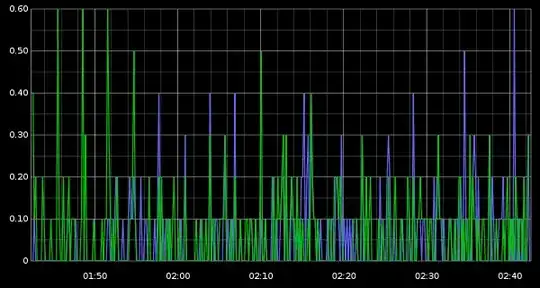
enter image description here

Can somebody point me in right direction as to where to go to remedy my issue ?

kaji
  • 2,510
  • 16
  • 17

2 Answers2

1

Since this is an old question (at the time of this answer), I'm just throwing this here as a reference for anyone else wondering the same thing.

Logstash's cookbook has an entry on understanding Graphite and how the data gets aggregated. See it here

If you happen to be using a newer version of logstash, then you'll have the statsd_count folder, which will give you the number of increments that Graphite received, instead of averaging it out over 10sec. for you.

Per the logstash cookbook entry, assuming you have 3 200 responses within a frame of 10 seconds, statsd would produce something alone the lines of:

stats.logstash.101010_1.apache.site1.response.200 = 3 / 10 = 0.3 (number of responses with status 200 per second)

However, in the statsd_count folder, you would see something along the lines of: stats_count.logstash.101010_1.apache.site1.response.200 = 3 (we have received 3 times status 200 for our period of 10 seconds)

Adam
  • 123
  • 1
  • 1
  • 8
0

Values on your graph is not integer, since it is average values.

statsd stores integer values of response counter to show a point on graph it reduces earlier counter value from later and divides it by step time. (Count(t)-count(t-step))/step.

DukeLion
  • 3,239
  • 1
  • 17
  • 19
  • so then how do i draw the graph(like above) that makes sense ? – kaji May 22 '12 at 10:29
  • graph based on log message will not make much sense anyway, due to log buffering.Write a plugin to statsd that get values from nginx stub_status module, or use [nginx-statsd](https://github.com/zebrafishlabs/nginx-statsd) – DukeLion May 22 '12 at 10:33