User interface
Graphite has some superb graphing tools available. The default web interface is ugly (although functional), but you then have a wealth of great graphing and dashboard options.
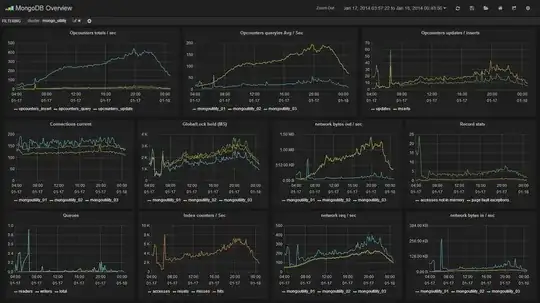
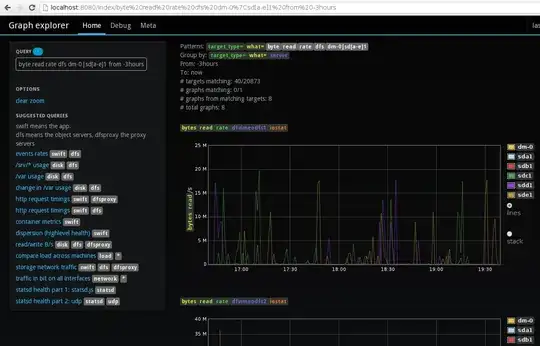
A few examples:
- Grafana dashboard, with dynamic (zoomable) graphs


Look here or here to find many more.
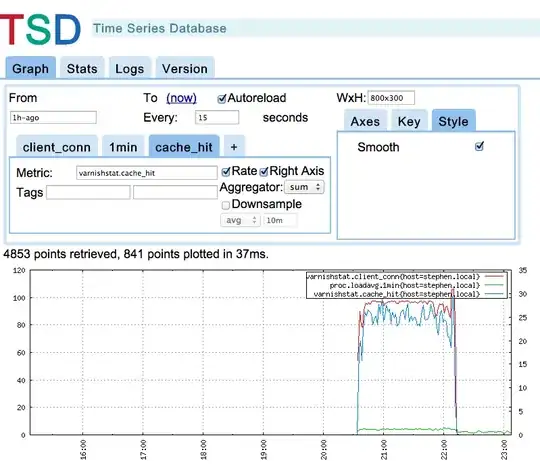
OpenTSDB on the other is still at the gnuplot stage:

Setup
In practice, Graphite is actually much more of a pain to setup than HBase + OpenTSDB. OpenTSDB has a comprehensive documentation and a few straightforward steps. These are the commands to install Graphite, things get even trickier if you build from source.
Performances
OpenTSDB does not deteriorate data over time, unlike Graphite where the size of the database is pre-determined.
True. Also Graphite uses a file format similar to RRD, in practice this means a single data point will take as much disk space as the full time serie since this space is pre-allocated. This also means plotting an empty time interval will take as much time as if there was data there (an alternative storage engine, Ceres, is in the work but I haven't tried it yet).
As tsuna said OpenTSDB will let you store significantly more data points, leveraging the power of Hadoop's HDFS. Graphite on the other hand, whose architecture is detailed in this AOSA chapter, is a more adhoc solution.
OpenTSDB can store metrics per second, as opposed to graphite which has minute intervals.
Nope, both can log down to the second.


