2

I need to monitor my Ubuntu Linux server performance, prior to diving into nagios / zabbix type of "enterprise server monitoring" solutions I would prefer something more lightweight.

My requirements are simple:

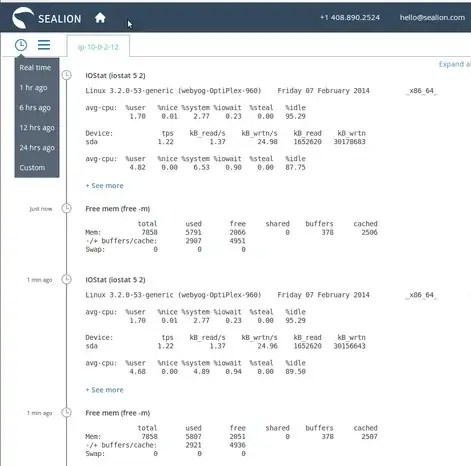
  • Works out of the box for basic metrics (memory, io, cpu, network, disk-space and co...)
  • Has web interface which shows graphs

The list of nice to have goes deep:

  • Has embedded http server (if it would be a ruby / python solution it would be awesome)
  • Has real time updating page
  • Can show what happened a week ago / month ago / custom range
  • Supports monitoring of software components: number of open file descriptors, jvm GC activity, opened TCP sessions in the last hour (and co.)
  • Has statistics

I've looked into ganglia, munin and they require Apache to be running the web front end.

-- Edit:

Effectively I would be happy for something that can collect and graph sysstat or dstat in rrd format and make it accessible as a web page

Maxim Veksler
  • 2,555
  • 10
  • 27
  • 32
  • 1
    What OS are you attempting to monitor? – Tim Brigham Jan 29 '12 at 18:18
  • @TimBrigham Thanks. I added the text "Ubuntu Linux". – Maxim Veksler Jan 30 '12 at 08:50
  • We already have a list of monitoring software http://serverfault.com/questions/44/what-tool-do-you-use-to-monitor-your-servers - if you have anything new to add - that's the place for it. – user9517 Feb 07 '14 at 08:22
  • If you want to find an alternative to a program use alternativeTo, for example: http://alternativeto.net/software/munin/ it's a handy webpage. – Stone Feb 07 '14 at 08:43
  • Nothing is really plug-and-play in the monitoring world. Everything requires configuration to some extent. That said you could do what you want with most tools (Nagios & InterMapper spring to mind as candidates). Pick a tool that meets most of your needs (use the dup for some ideas of what to look at/for), and ask a more specific question ("How can I monitor `X` with tool `Y`?") if you're not sure how to get a specific metric into the tool and we'll be happy to help. – voretaq7 Feb 07 '14 at 21:46

3 Answers3

1

There are some well known software tools like M/monit and Cacti. These present data in the form of graphs, that's easy to read.

SeaLion is another tool that seems to be a better fit in your case although its not well-known. It provides data i.e. raw outputs, preferred for debugging an issue rather than just finding an occurance. It's extremely easy to setup and works in real time as required. Checkout the interface to see if its what you want.

SeaLion

You can execute any commands that you would require to monitor your servers. Here I have used just one server;You can also monitor multiple servers.Seems to be the best fit among the things that I have checked.

You can now choose based on your preference.

Kevin
  • 131
  • 2
0

You could try something like Server Density (http://www.serverdensity.com/). Although it is not free, it is quite a nice service.

And because Server Density allows plugins, you can literally build anything to monitor on the system with ease.

Taylor Jasko
  • 686
  • 4
  • 13
0

sysstatgraph looks like a nice start

Maxim Veksler
  • 2,555
  • 10
  • 27
  • 32