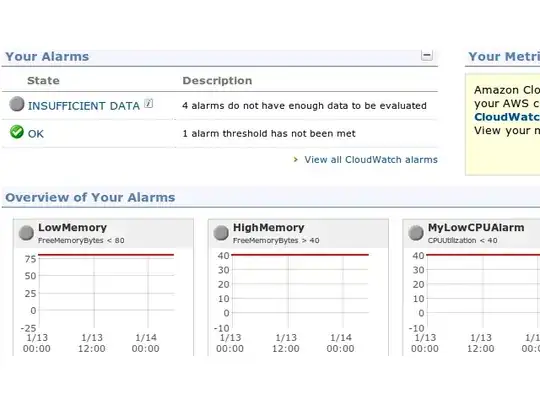
Once you have the memory metrics logged to Cloudwatch, you simply need to setup autoscaling as you would for any existing metric.
Firstly, as with all the AWS command line tools, you need to set (export) either:
- AWS_CREDENTIAL_FILE or
- both: EC2_PRIVATE_KEY and EC2_CERT
Next you run the following three commands, modifying them as per your needs (these are just run from the command line - once - not from cron).
Create the launch config:
You need to pass an image and instance type at very least, additional parameters are optional, but probably a good idea.
as-create-launch-config
        LaunchConfigurationName  --image-id  value  --instance-type  value
       [--block-device-mapping  "key1=value1,key2=value2..." ] [--kernel  value]
       [--key  value ] [--ramdisk  value ] [--group  value[,value...] ]
       [--user-data  value ] [--user-data-file  value ]  [General Options]
For example:
as-create-launch-config config-name --image-id AMI-xxxxxxxx --instance-type m1.small --key keypair-name --group security-group-name
Create the autoscaling group:
Here we define the parameters for scaling - where the instances will be launched, the limits on the number of instances, and associate the group with the config we created.
as-create-auto-scaling-group
        AutoScalingGroupName  --availability-zones  value[,value...]
        --launch-configuration  value  --max-size  value  --min-size  value
       [--cooldown  value ] [--load-balancers  value[,value...] ]
        [General Options]
For example:
as-create-auto-scaling-group as-group-name --availability-zones us-east-1a --launch-configuration config-name --min-size 1 --max-size 5 --cooldown 300
(You can also specify a --desired-capacity which is the number of instances to start with, if it is different than the min-size)
Create a policy to scale with:
Here we define the action that will be performed when an alarm is triggered and associate the policy with a specific autoscaling group. Create one policy for scaling up, and one for scaling down.
as-put-scaling-policy
        PolicyName  --type  value  --auto-scaling-group  value  --adjustment
       value [--cooldown  value ]  [General Options]
This command outputs a ARN that will be needed in order to associate the policy with a cloudwatch alarm - note down the ARN. Each command will return a different ARN - i.e. you will have 2 ARNs - remember which one is for which policy.
For example:
Scale-up:
as-put-scaling-policy HighMemPolicy --auto-scaling-group as-group-name --adjustment=1 --type ChangeInCapacity --cooldown 300
Scale-down:
as-put-scaling-policy LowMemPolicy --auto-scaling-group as-group-name --adjustment=-1 --type ChangeInCapacity --cooldown 300
Example return:
POLICY-ARN arn:aws:autoscaling:us-east-1:0123456789:scalingPolicy/abc-1234-def-567
Create a Cloudwatch alarm for each case:
We need to use our collected data to trigger an alarm under specific circumstances, and then have that alarm execute the appropriate scaling policy. You will need 2 alarms - one for the upper threshold, and one for the lower threshold.
mon-put-metric-alarm
        AlarmName  --comparison-operator  value  --evaluation-periods  value
        --metric-name  value  --namespace  value  --period  value  --statistic
       value  --threshold  value [--actions-enabled  value ] [--alarm-actions
       value[,value...] ] [--alarm-description  value ] [--dimensions
       "key1=value1,key2=value2..." ] [--insufficient-data-actions
       value[,value...] ] [--ok-actions  value[,value...] ] [--unit  value ]
        [General Options]
For example:
Upper threshold:
mon-put-metric-alarm HighMemAlarm --comparison-operator GreaterThanThreshold --evaluation-periods 4 --metric-name UsedMemoryPercent --namespace "AWS/EC2" --period 60 --statistic Average --threshold 85 --alarm-actions arn:aws:autoscaling:us-east-1:0123456789:scalingPolicy/abc-1234-def-567 --dimensions "AutoScalingGroupName=as-group-name"
Lower threshold:
mon-put-metric-alarm LowMemAlarm --comparison-operator LessThanThreshold --evaluation-periods 4 --metric-name UsedMemoryPercent --namespace "AWS/EC2" --period 60 --statistic Average --threshold 60 --alarm-actions arn:aws:autoscaling:us-east-1:0123456789:scalingPolicy/bcd-2345-efg-678 --dimensions "AutoScalingGroupName=as-group-name"
In the above example, we are using the metric 'UsedMemoryPercent' (from the forum script) and are looking at the 'average over 60 seconds'. For the first alarm, if that average exceeds 85% for 4 consecutive samples (i.e. 4 minutes) we will trigger the alarm (and execute the action), For the second alarm, we look for 'less than 60%'.
Good references include:
Run the command with --help to see the details of the parameters.
