1

On a quad-core server with 8GB of ram I have apache processes that use up to 2.3GB RES memory and 2.6GB VIRT memory. Here is a copy of the top -c command: Top command
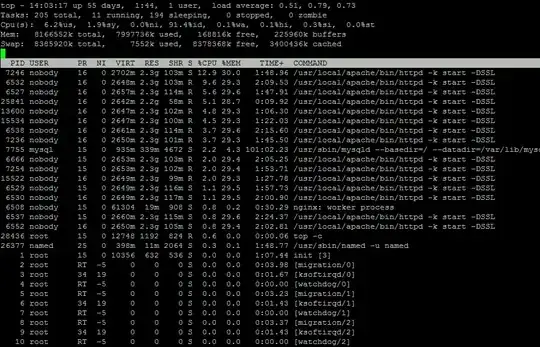
Is there a way to reduct the memory usage for these apache processes?

These are my httpd.conf settings:

Timeout 160
TraceEnable Off
ServerSignature Off
ServerTokens ProductOnly
FileETag None
StartServers 6
<IfModule prefork.c>
MinSpareServers 4
MaxSpareServers 16
</IfModule>
ServerLimit 400
MaxClients 320
MaxRequestsPerChild 10000
KeepAlive On
KeepAliveTimeout 4
MaxKeepAliveRequests 80

Note: There seems to be some connection delay. Also if 16 connections are using 8GB or ram. I am a bit worried that if my server gets 300 connections, it will go offline. Also in Munin I can see the committed memory rise from a few GB tot 80GB within 2 weeks. With every apache restart it goes down to a few GB again

Frederik
  • 3,293
  • 3
  • 30
  • 46
lisa
  • 11
  • 1
  • 2
  • Your server health looks fine. Are you experiencing any performance problems you are trying to solve? – Mircea Vutcovici Sep 19 '11 at 12:27
  • Yes, there seems to be some connection delay. Also if 16 connections are using 8GB or ram. I am a bit worried that if my server gets 300 connections, it will go offline. Also in Munin I can see the committed memory rise from a few GB tot 80GB within 2 weeks. With every apache restart it goes down to a few GB again. – lisa Sep 19 '11 at 12:51
  • A memory leak is not connected to a huge initial amount of memory used but a slow growth of memory usage over time. It’s most likely your settings are just too RAM hungry for your setup. Detailed answer below. – Giacomo1968 Nov 09 '13 at 05:38

4 Answers4

1

The memory in Apache is used by modules and by memory used by modules. Disable unused modules and to see which remaining one you have to tune use pmap <PID> to see how the memory was allocated. Use dmalloc and valgrind to debug the remaining memory allocation problems.

Mircea Vutcovici
  • 16,706
  • 4
  • 52
  • 80
0

This is unusually high memory usage. There might be a memory leak.

For now, try updating your Apache2 installation (including modules) and reduce the number of MaxRequestsPerChild, i.e. to 500. The latter setting essentially reduces the maximum lifetime of Apache2 sub-processes in terms of "requests processed". That is, if there are memory leaks, they will not build up as dramatically.

robert
  • 143
  • 6
0

Removing unnecessary modules is the basic solution to the problem, but you've got to be running an insane bunch of modules to get an Apache process that takes 2GB of RAM. It's far more likely that you've got dynamic code modules (such as mod_php) that's running nasty, leaky code, or else a module that's poorly coded and leaking memory itself.

You can drop MaxRequestsPerChild to something quite small, or you can do the job properly and find the memory leaks. A middle ground is to at least push the dynamic code execution out to a separate process (using suPHP, suexec, php-fpm, etc), which is a good idea anyway for security purposes.

womble
  • 95,029
  • 29
  • 173
  • 228
  • I tried suPHP but it stopped some sites from working and gave lots of directory permission errors. The websites are running wordpress and 2GB for a apache process is huge! That is why I am worried. How do I know which modules are not needed? – lisa Sep 19 '11 at 12:53
  • The modules that aren't needed are the ones you aren't using... knowing which modules you aren't using is part of administering the server. – womble Sep 19 '11 at 12:58
  • I rebuilt apache and now have 2.2.20, removed mod_perl and set MaxRequestsPerChild to 1000. Now the memory usage is around 500mb VIRT and 150 RES. Thank you – lisa Sep 19 '11 at 13:31
0

I don’t know what kind of traffic you are seeing that would require such settings, but it seems like your settings could be lowered to make better use of resources since it seems like you are overcommitting Apache from the get-go & do not have it configured for realistic site traffic. Unless you can provide some site stats that justify the high numbers of the initial config.

Key is MaxRequestsPerChild which will help prevent memory leaks by re-spawning parent processes more often. Also, I lowered ServerLimit and MaxClients since that is related to how many clients are connected PER SECOND. So if someone grabs a page from your site, and it renders in 1 second, guess what? The server has done it’s job. Related to that I lowered MaxKeepAliveRequests and the KeepAliveTimeout to be more realistic again. I also lowered the general Timeout since 120 seconds is 2 minutes. If a client is taking 2 minutes to get content from you that is more than a generous amount of time to give them before the server times out. I like to keep that number in place just in case a high traffic scenario comes around.

Remember: A web server doesn’t keep a constant connection between the server and the client. A client makes a request, the server delivers the page and that’s it. So tune with that in mind. Also, please read this other answer I provided to another poster who was worried about memory usage on their web server.

Timeout 120
TraceEnable Off
ServerSignature Off
ServerTokens ProductOnly
FileETag None
StartServers 6

<IfModule prefork.c>
  MinSpareServers 4
  MaxSpareServers 16
</IfModule>

ServerLimit 80
MaxClients 60
MaxRequestsPerChild 2000
KeepAlive On
KeepAliveTimeout 2
MaxKeepAliveRequests 30
Giacomo1968
  • 3,522
  • 25
  • 38
  • I think `MaxRequestsPerChild 2000` is a bit overconservative. I usually set it at 30000 or more. You don't need to kill the children so often. – ThoriumBR Feb 01 '16 at 13:51