0

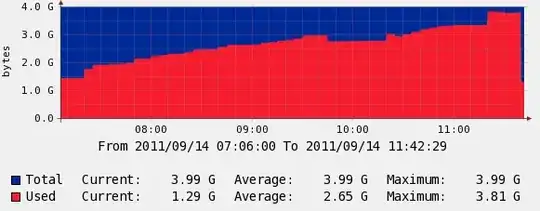
We have a 3rd party application that runs on an IIS web server, during the day as people use it, it seems to take up more and more memory until the server is very close to the memory limit and we get nagios alerts. Here is a graph of a few hours this morning, IIS was restarted at 11:40, some of this ramp up will be due to people starting work but I suspect not all of it, the spike at 11:20 is of perticular concern.

Graph of issue

I need help tracking down what module or script in this application might be leaking memory, any ideas or suggestions on tools to extract this data?

Thanks Jona

Jona
  • 746
  • 1
  • 9
  • 17

1 Answers1

0

Tried DebugDiag 1.2 (aka the Debug Diagnostic Toolkit)?

While working it out, you might want to implement memory-based recycling triggers for the application. If you meant "restart IIS" when you said "restart IIS", and not just "recycle the application pool", you don't need to go to that length, and recycling results in less (i.e. near-zero or zero, depending on the app) downtime.

TristanK
  • 8,953
  • 2
  • 27
  • 39
  • Thanks for your answer, I have tried the Debug Diagnostic Toolkit however it didn't give me any script level debug information, I don't know if there is a way to force it to do this? – Jona Sep 14 '11 at 13:38
  • You need to supply much more information to get beyond a vague answer, sorry! Like: What's the application, how does it work/what's it written in, is it a w3wp leaking memory or another process, history of the problem, is the graph above total memory, is the total memory on the box 4GB or is that just one process, and so on. DD can't fake "script-level" information, but it can debug managed and unmanaged dumps, providing the symbols are set up correctly - for .Net it takes a bit of work to get mscordacwks set up correctly for symbolic information - but right now, we know nothing about the app. – TristanK Sep 14 '11 at 13:45