The vSphere client for the iPad is brilliant, however I'm having a bit of trouble determining the X-axis scale for the graphs.
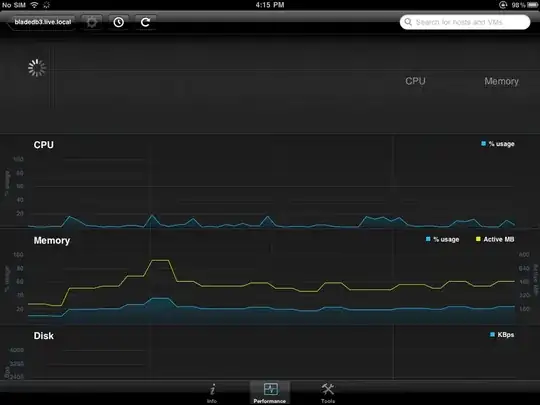
What kind of time frame is that over? 5 minutes? 10 minutes? 1 hour? I've tried lining up its peaks in processor usage against our logging, but because VMWare only seems to be snapshotting every 60 seconds, and we snapshot every 10 seconds, it's pretty difficult to get any sort of average (plus the iPad is 10" and our normal performance graphs are 50" so you can't even kinda hold it up against the other graphs and squint, which I did try).
Does anyone know what time scale the performance graphs are over?