17

I have server which runs liquidsoap+icecast bundle and simple website (httpd+mysqld). Nothing special. Visitors around 2000+ per day, with around 50 being online simultaneously on average.

Server has 8GB RAM. As the time goes by, amount of free memory constantly decreases, although nothing new is started on server and there are no new users. At some point it starts to swap, load on server goes up and it becomes unresponsive. Usually what I do is just restart the server...

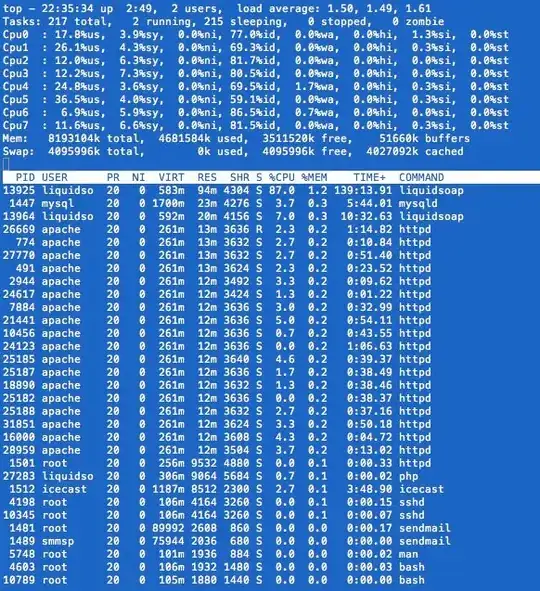
What can be done to detect what exactly leaks memory? I use top to monitor usage of resources, but as far as I see it shows nothing helpful:

enter image description here

Is there any way to find out what uses that much memory? or what starts to swap to disk heavily? Any way to free up memory without rebooting the server?

jayarjo
  • 337
  • 1
  • 3
  • 12
  • Any reason why you don't try restarting some of the services (apache, liquidsoap) instead of the server? – jamespo Apr 09 '11 at 21:48
  • I originally responded for normal memory usage. I have updated with a set of tools which may help identify the problem. – BillThor Apr 10 '11 at 01:28
  • @jamespo, actually I tried that, but it had no effect, so restart was the only thing I knew could help. – jayarjo Apr 10 '11 at 12:01
  • The 4027092k cached should explain the memory usage, no? I'm working at the moment on a similar problem elsewhere, and so far I've managed to figure out the memory transfer can be regulated with the following params: vfs_cache_pressure vm.dirty_ratio vm.dirty_background_ratio This is not a complete fix and any feedback's most welcome. I hope it's a right direction to go. –  Feb 08 '16 at 23:44

4 Answers4

18

Running top in batch mode to report memory sizes periodically can be used to see who is using the memory when things go south. Runing sar in batch mode should give some good diagnostics on memory use, and related I/O. Running munin to monitor the system should give you a graph with good detail on what memory is being used for. This may help a lot.

You can use limits.conf to limit the maximum core size of programs. Properly set, this should kill any programs which are leaking memory. This works with the pam_limits module. Limits can also be set with the ulimits command.

You are running a few programs which could use large amounts of memory. Some things you could look at include.

  • Poorly programmed applications running under apache2 can leak memory. You should see the memory size increase when this happens. You can tune apache2 to recycle children after a certain number of uses by setting MaxRequestsPerChild to 100 or so. If this resolves the problem, then you need to resolve the leak. I would watch this first.
  • MySQL may try to load data into memory. If you have a lot of data in memory this may cause some thrashing, but should not be as dramatic as you are seeing.
  • If you have a large tmpfs file system mounted, then you may leak memory if files are not deleted when used. Large long lived files can also be a problem.
  • If the problem is occurs at roughly the same time of day, you may have a scheduled program which is leaking memory.
  • If you have a program that allocates shared memory, but does not release it before exiting, you will have a relatively invisible memory leak. If the shared memory is locked in memory, then it may force swapping. The amount of available shared memory is typically relatively limited.
  • The liquidsoap+icecast bundle could run into buffering issues that use memory. I haven't used this combination, so I am not sure how this would appear.

Normal memory usage: Free memory is not something you want a lot of. If your system has been up for a long time and has a lot of free memory something is wrong. Every time you read or write a file, the blocks will go into the buffer cache. This will reduce your free memory, and is a good thing. The system will keep enough free space to start a few programs without looking elsewhere for memory. As many programs run quickly, their memory will be returned to the free pool when they stop running.

When you read a file that is in buffer cache, no disk access is required and the read is resolved from the buffer cache. Writes use a similar mechanism. If your system needs memory, the buffer cache is one of the first places that is used. Most buffers can be released immediately.

If you have a memory leak, you will see free memory and buffers both begin to shrink. This is still not a severe problem, as the leaked memory should eventually be moved to swap space. Your system will still run fine until you fill the swap space, and draw down the remaining free space to the point programs can't be started. It is typical that a small amount of swap space may be used.
BillThor
  • 27,354
  • 3
  • 35
  • 69
  • The problem in my case is kinda weird. Even when the load is huge and server swaps heavily, there's plenty of free memory (as I understood after I read about buffers and caches). top doesn't show any process hogging memory increasingly. But load goes up and at some point server becomes unusable :| Thanks for the detailed response. – jayarjo Apr 10 '11 at 12:12
  • 2
    @jayarjo: Munin and sar should help detecting what is going on. If you have lots of free memory you shouldn't be swapping. You may have a different I/O problem. `sar` will help pinpoint which partition has the I/O and may help discover the problem. – BillThor Apr 10 '11 at 16:52
  • +1 for MaxRequestsPerChild advice – jamespo Apr 10 '11 at 19:46
13

You can use this command to see the top 10 applications regarding RAM usage:

ps -A --sort -rss -o comm,pmem | head -n 11

Sometimes this command helps you if many sub processes have been generated:

ps auxf

This way you can see which processes belong together.

Raffael Luthiger
  • 2,011
  • 2
  • 17
  • 26
  • These are handy commands, thanks I will note them for future. But the problem is that there are always the same processes on top (you can see them in attached screenshot) - apache, mysql, liquidsoap, icecast. And they use (or at least are shown to use) the same amount of memory (negligible really), even when server is dying of load :| – jayarjo Apr 10 '11 at 12:04
  • @jayarjo: Does the number of processes change? Do you have a lot more processes? And is it a physical server or a virtual one? – Raffael Luthiger Apr 10 '11 at 12:40
  • I've not noticed any change in number of processes. Basically when I do top, while server is dying of load I see a very similar picture to what I've attached in original question, except the huge load :| Server is physical. – jayarjo Apr 10 '11 at 14:16
  • 2
    Try to get more information with "vmstat" (e.g. vmstat -s). Or with the already mentioned tool "sar". Do you maybe have a RAM based filesystem? Then maybe "iostat" can give more information as well. – Raffael Luthiger Apr 10 '11 at 16:16
  • 1
    I have been in doubt whether the "pmem" (%MEM) field in `ps` or `top` output is the right thing to look at if trying to detect a memory leak: Isn't this only the percentage of the physical memory the process currently is using? But other parts of the process's used (incl. leaked) memory may be swapped out. Perhaps "size" or "vsize" would be more appropriate for measuring the size of a process? E.g., `ps -A --sort -size -o comm,size | head -n 11` or `ps -A --sort -vsize -o comm,vsize | head -n 11` – imz -- Ivan Zakharyaschev Jul 29 '12 at 05:05
8

Nothing is really using that memory in terms of applications.

You need to deduct the 'cached' value which represents the page cache to get a better idea as to what your actual memory usage is in terms of program usage.

Basically this is good memory management and this is ideally what you want.

See the link here for more infomation: http://www.linuxatemyram.com/

Matthew Ife
  • 22,927
  • 2
  • 54
  • 71
  • yes found that link and read about buffers and caches, but as far as I could get from what I read, they cannot cause swapping, can they? – jayarjo Apr 10 '11 at 12:05
  • @jayarjo I think to understand what happens there we would need stats demonstrating the problem then. The numbers you have given do not show swapping or a lot of real memory usage. – Matthew Ife Apr 12 '11 at 13:12
1

I am not a pro at this really, but liquid soap+icecast is multimedia related. When the system is free, it caches and/or occupies memory for future use. And if the traffic increases at a certain time of the day/ over a period of time, then it will start swapping. At this point, if the requests ( users viewing content) increases, then the resources needed will be more than 8GB of ram.

Yash
  • 11
  • 1