14

We have a bunch of large HDTVs in our monitoring office keeping an eye on all of our production equipment.

We are monitoring:

Cisco routers

  • HP switches
  • HP proliant servers
  • Windows 2003
  • IIS
  • SQL server

At the moment we use

  • Nagios for uptime/availability and alert sending
  • Cacti for bandwidth usage
  • Perfmon running on Vista for server performance
  • A combination of other tools and our own custom code to monitor our actual application performance.

All of this is fine apart from the Perfmon part - it gives us what we want - i.e. real time charts on the screen, logging certain performance counters, etc - the only problem is setting it up is a real chore. If the Vista PC running Perfmon is rebooted (normally due to Windows Update) then setting all the counters up again takes ages - literally an hour or two's worth of work for somebody in the office...

Anybody know of a way to either: 1. Script adding Perfmon counters 2. Another tool with graphical output and WMI/windows counter access.

Thanks

  • Mike
Mike McClelland
  • 810
  • 3
  • 10
  • 19
  • Whilst I haven't finished this exercise - I am most likely to use PowerGadgets... Looks good, works the way I want, etc. Will post back any solutions to this page. Thank you very much to everybody who's responded - what an awesome community! Mike – Mike McClelland Jun 17 '09 at 13:00

16 Answers16

4

I would seperate out the charting/display from the montioring/alerting piece. You haven't said how many object you have. For most shops I'd write a powershell script to get the counters I want and pipe the output to powergadgets and for small shops use polymon to monitor the windows stuff and groundwork to monitor the rest. In a larger environment (30+ servers) I'd take a look at System Center Operations Manager for monitoring and alerting. You have to realize howver that SCOM is NOT just monitoring. It's designed to correct problems and ensure business service, unlike most monitoring software that only cares about server counters. Other options would be tivoli or openview.

Jim B
  • 23,938
  • 4
  • 35
  • 58
3

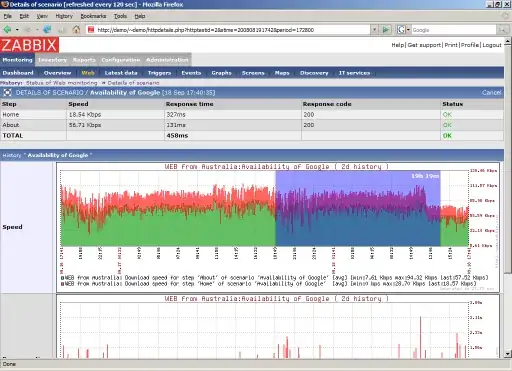
I highly recommend Zabbix to system administrators looking for monitoring and graphing solutions.

Zabbix has clients (agents) for Windows and Linux systems. They can also read SNMP packets to graph and monitor stats from just about anything.

I've been using it for 3 years and it has been (relatively) very easy to manage and keep updated.

They even have application monitoring if you are willing to script the actions for it.

Zabbix
(source: zabbix.com)

Let me know if you have any specific questions about usage.

Glorfindel
  • 1,213
  • 3
  • 15
  • 22
Dave Drager
  • 8,315
  • 28
  • 45
2

if not realtime charts [ that is with few minutes sampling time ] are ok for you - take a look at Munin Node for Windows. alternatively you can probably fetch plenty of statistics from windows via snmp but i've tried it long time ago and abandoned idea quite quickly. munin-node was just enough.

pQd
  • 29,561
  • 5
  • 64
  • 106
  • Hi pQd - looks great - I'd struggle with getting permission to install the client app on our production kit! Seems silly to use something 3rd party when 'it's all there' in the Windows Framework... – Mike McClelland Jun 07 '09 at 09:22
  • 1
    you don't need to install anything, you can perfectly monitor a windows with snmp (in combination with munin) http://munin.projects.linpro.no/wiki/HowToMonitorWindows – Martin M. Jun 13 '09 at 19:27
  • SNMP won't give you acces to any raw perfmon counters you might need. (eg you want to create a task manager type display), but you shouldn't need to actually install any software agents as long as WMI is accessable – Jim B Jun 15 '09 at 17:38
2

"Another tool with graphical output and WMI/windows counter access..."

PolyMon has a good general dashboard display, results are in db for long term trending/reporting. WMI, Perfmon, SNMP, Ping, TCP Port, Powershell....

For extremely configurable real-time display, (all the same data sources) a variant of the same product is PolyMonRT

I love em.

mguassa
  • 105
  • 4
Bob
  • 597
  • 2
  • 8
2

Perfmon can be scripted, and the settings can be saved in Vista. Perfmon can even logged to a MSSQL database. Here's how to do it.

  1. Setup a database server
  2. Create an ODBC connection on the system which you are running perfmon
  3. Create a new perfmon counter and direct it towards the ODBC connection
  4. Startup perfmon, and watch it log

PROTIP: You can setup your single vista machine to also remotely log perfmon data from other systems.

And here's how you can generate a report or two from the data you've collected.

Joseph Kern
  • 9,809
  • 3
  • 31
  • 55
  • 1
    You don't even need to set up the database server ... But in my experience dealing with spreadsheets on a monthly basis is a real pain. Why not use Nagios? I tried SCOM, hated it. Then switched to Zenoss (Nagios offshoot) and love it. Your Nagios rrd graphs will transfer to Zenoss and everything. http://www.zenoss.com/ There's a paid and a free version of zenoss available. Good luck! – Joseph Kern Jun 12 '09 at 16:18
2

OpenNMS 1.7.x has WMI support. OpenNMS

Otherwise I would go the Nagios/RRD route as joseph suggested.

JakeRobinson
  • 2,886
  • 17
  • 26
1

Samurize is great for designing visual realtime perfmon displays. You design everything in an editor, including graphics and overlays. It can run as a widget on the desktop or in the background, generating image files periodically.

spoulson
  • 2,173
  • 5
  • 22
  • 30
1

Admin Arsenal has a great perfmon monitor with graphical charting. It's free to try.

Shawn Anderson
  • 542
  • 7
  • 14
1

It is understandable that the setup of 4 different monitoring tools can be quite a lot of work. Since you are already using nagios (the best opensource monitoring tool ever) I would consider integrating all the functionality for your monitoring in the same place (NAGIOS). I have used nagios to monitor all elements you have in your system (sql server, network devices, windows machines...) and more (linux servers, solaris servers, java applications, etc). My recommendation for you is the following:

* Cisco routers, HP switches, HP prolient servers: Use check_snmp_int and check_snmp in nagios (you get exactly the same information cacti uses), then install pnp4nagios in your nagios server (that gives you the nice graphs, not just for snmp data but for everything else) 
* Windows 2003, IIS, SQL Server: Install NSClient++ on your windows machines (nagios client for windows), then you can to access all performance counters, WMI objects and more from nagios. Pnp4nagios takes then care of the graphs.

Good Luck

//Marco

  • Hi Marco, that's an awesome answer - thanks very much. Only problem is that I don't really want to install anything on the servers that is neither our application of the OS (and any OS supporting stuff)... I'll check out the NSClient though and post back here if I have any comments/feedback. Thanks again for your time. Mike – Mike McClelland Nov 01 '09 at 12:48
0

After you have added all the counters you can save the resulting config as an msc file. Then just open the .msc to reopen the monitor.

JR

John Rennie
  • 7,756
  • 1
  • 22
  • 34
  • Hi RennieJ. Yes, you can - BUT if the machines you are monitoring are not local to the domain of the monitor PC (I think is the reason) - then that technique doesn't work - the .msc opens but doesn't connect. It used to on Perfmon XP, but Perfmon on Vista is different - and apart from this 'feature' is much better. – Mike McClelland Jun 07 '09 at 08:34
  • Hmmm, possibly an authentication problem? If you do a net use \\target\ipc$ before opening the .msc does that make any difference? – John Rennie Jun 07 '09 at 13:32
  • Yeh, we had a batch file that connected to all the shares and get's a handle BEFORE opening PerfMon. Under XP this worked, but not the Vista version... We'd revert to XP, but the Vista version has other benefits - i.e. the .MSCs now remember exact layout, and perfmon now supports limits other than 100 - so you can get better granularity of perf when for example CPU is 0-25% - which it normally is... – Mike McClelland Jun 07 '09 at 14:45
  • >perfmon now supports limits other than 100 Hmmm, W2k3 perfmon supports this. Are you sure XP doesn't (I don't have an XP handy to check)? Just right click, go to the Graph tab and change the graph maximum. – John Rennie Jun 08 '09 at 18:07
0

Will logman let you script Performance Monitor to your satisfaction? I also found a script which may help.

crb
  • 7,928
  • 37
  • 53
0

Use RoboTask to simulate mouse and keyboard activity, since it sends virtual mouse clicks and keystrokes it can automate any given task in any application. You can setup a task that runs at startup or at a scheduled time, and watch in wonder as your computer automatically does your "chore" jobs as fast as the application can respond. (if your app hangs up for 10 minutes, obviously you'll have to delay the script for 10 mins)

RoboTask can even communicate with instances of itself on other computers, thereby allowing you to "centrally" control/start many tasks at once. Conditions and Loops are also available for those with basic programming knowledge.

"Writing" a task is something like working with scripts, just that you won't be typing anything since all the available "commands" are listed down with custom GUIs. You'll have to specify delays between each action to give time for the program to respond, even if the delays are in milliseconds.


Alternatively you can use Automation Anywhere, that is easier to configure since you can "record" your activity and then let it "play back", effectively creating a "script" that can be simulated over and over again.

Robin Rodricks
  • 540
  • 2
  • 10
  • 27
0

SCOM 2007 can do it. Anyway the tool you will use, take care of not overloading the system through the monitoring.

Digging in not so used WMI can reveal WMI troubles. Our SCOM revealed problem because of too deep WMI query with not cached Data. We had to apply hotfix for keeping WMI working.

Mathieu Chateau
  • 3,175
  • 15
  • 10
0

Referenced on another post on how to monitor your windows server What tool do you use to monitor your servers? There's a tool from codeplex named PAL, i usually define all the counters i need on a server and schedule them to start automaticly and run for 5 minutes every hour. The output is thrown into blg binary files that i later on crunch using PAL (M$ LogParser) and generate my reports. This task can be automated so the reports be sent by mail.

PAL Tool : pal.codeplex.com

Paul
  • 714
  • 2
  • 6
  • 19
0

Hmm - all the above are valid options, and some are probably better than the perfom solution.

But for your Perfmon solution, you can kind of save and load a counter set.

Set up the PerfMon display with the appropriate counters. Right click the chart and select Save Settings As... and enter the appropriate name. This will save the counters as an HTML file.

Restart PerfMon (or right click and select Remove All Counters). Open the above saved html file in NotePad, and select it all and copy it to the clipboard.

Click the clipboard icon (Paste Counter List) or press ctrl - v.

Christopher_G_Lewis
  • 3,647
  • 21
  • 27
  • Hi Chris, yes agreed it can do that but the problem is getting the handles to the servers. We can open the C$ share, even open files on the remote FS, but PerfMon refuses to accept that the handle is there and wants you to make a new one - which takes about 90seconds per counter - and we have lots of servers and counters! Mike – Mike McClelland Jun 17 '09 at 10:42
  • Yea, I can see the time delay, but for me its about 30 secs. That's kind of a bummer. – Christopher_G_Lewis Jun 17 '09 at 13:33
0

Disclaimer: My $.02 as the Zenoss Community Manager.

Zenoss does everything you want: Cisco, HP switches and servers, Windows servers and applications via WMI. Uptime/availability, bandwidth usage and alert sending (plus you can re-use your existing Nagios and Cactii plugins). Plus it's free and open source and doesn't use any agents and has a very large and active community of users monitoring a very diverse set of hardware and services.

Doug Luxem
  • 9,592
  • 7
  • 49
  • 80
mray
  • 617
  • 5
  • 4