The monitoring software we use has been flagged a box that serves two apps:
- Confluence (xms: 1 GB, xmx: 2 GB)
- JIRA (xms: 1 GB, xmx: 1 GB)
These are the only two applications on the box; nothing else but it is a VM.
Server Config
- VM (VMWare)
- RedHat EL 5
- 2 GB memory allocated
The Graph
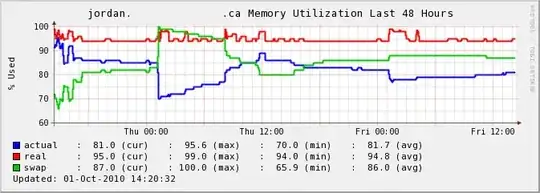 What's really weird to me is that peak times should be between 8 AM and 5 PM, but on Thursday morning, from 1 AM to 8 AM. Not as bad, but Friday is similar--swap is being used though there's no load I'd expect at that time.
Help?