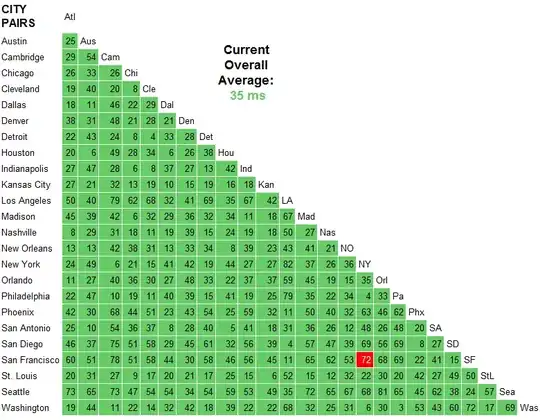
Several of the answers here are using ping and traceroute for their explanations. These tools have their place, but they are not reliable for network performance measurement.
In particular, (at least some) Juniper routers send processing of ICMP events to the control plane of the router. This is MUCH slower than the forwarding plane, especially in a backbone router.
There are other circumstances where the ICMP response can be much slower than a router's actual forwarding performance. For instance, imagine an all-software router (no specialized forwarding hardware) that is at 99% of CPU capacity, but it is still moving traffic fine. Do you want it to spend a lot of cycles processing traceroute responses, or forwarding traffic? So processing the response is a super low priority.
As a result, ping/traceroute give you reasonable upper bounds - things are going at least that fast - but they don't really tell you how fast real traffic is going.
In any event -
Here's an example traceroute from the University of Michigan (central US) to Stanford (west coast US). (It happens to go by way of Washington, DC (east coast US), which is 500 miles in the "wrong" direction.)
% traceroute -w 2 www.stanford.edu
traceroute to www-v6.stanford.edu (171.67.215.200), 64 hops max, 52 byte packets
 1  * * *
 2  * * *
 3  v-vfw-cc-clusta-l3-outside.r-seb.umnet.umich.edu (141.211.81.130)  3.808 ms  4.225 ms  2.223 ms
 4  l3-bseb-rseb.r-bin-seb.umnet.umich.edu (192.12.80.131)  1.372 ms  1.281 ms  1.485 ms
 5  l3-barb-bseb-1.r-bin-arbl.umnet.umich.edu (192.12.80.8)  1.784 ms  0.874 ms  0.900 ms
 6  v-bin-arbl-i2-wsu5.wsu5.mich.net (192.12.80.69)  2.443 ms  2.412 ms  2.957 ms
 7  v0x1004.rtr.wash.net.internet2.edu (192.122.183.10)  107.269 ms  61.849 ms  47.859 ms
 8  ae-8.10.rtr.atla.net.internet2.edu (64.57.28.6)  28.267 ms  28.756 ms  28.938 ms
 9  xe-1-0-0.0.rtr.hous.net.internet2.edu (64.57.28.112)  52.075 ms  52.156 ms  88.596 ms
10  * * ge-6-1-0.0.rtr.losa.net.internet2.edu (64.57.28.96)  496.838 ms
11  hpr-lax-hpr--i2-newnet.cenic.net (137.164.26.133)  76.537 ms  78.948 ms  75.010 ms
12  svl-hpr2--lax-hpr2-10g.cenic.net (137.164.25.38)  82.151 ms  82.304 ms  82.208 ms
13  hpr-stanford--svl-hpr2-10ge.cenic.net (137.164.27.62)  82.504 ms  82.295 ms  82.884 ms
14  boundarya-rtr.stanford.edu (171.66.0.34)  82.859 ms  82.888 ms  82.930 ms
15  * * *
16  * * *
17  www-v6.stanford.edu (171.67.215.200)  83.136 ms  83.288 ms  83.089 ms
In particular, note the time difference between the traceroute results from the wash router and the atla router (hops 7 & 8). the network path goes first to wash and then to atla. wash takes 50-100ms to respond, atla takes about 28ms. Clearly atla is further away, but its traceroute results suggest that it's closer.
See http://www.internet2.edu/performance/ for lots of info on network measurement. (disclaimer, i used to work for internet2). Also see: https://fasterdata.es.net/
To add some specific relevance to the original question... As you can see I had an 83 ms round-trip ping time to stanford, so we know the network can go at least this fast.
Note that the research & education network path that I took on this traceroute is likely to be faster than a commodity internet path. R&E networks generally overprovision their connections, which makes buffering in each router unlikely. Also, note the long physical path, longer than coast-to-coast, although clearly representative of real traffic.
michigan->washington, dc->atlanta->houston->los angeles->stanford
