I'm trying to configure nginx ingress to access several services, like this:
apiVersion: extensions/v1beta1
kind: Ingress
metadata:
  name: ingress-monit
spec:
  rules:
  - host: grafana.localhost
    http:
      paths:
      - path: /
        backend:
          serviceName: prometheus-grafana
          servicePort: 80
  - host: kubernetes-dashboard.localhost
    http:
      paths:
      - path: /
        backend:
          serviceName: kubernetes-dashboard
          servicePort: 80
I've access to the grafana service without any problems, my issue is with kubernetes-dashboard. I've already configured kubernetes-dashboard to allow HTTP traffic with this configuration
kind: Service
apiVersion: v1
metadata:
  labels:
    k8s-app: kubernetes-dashboard
  name: kubernetes-dashboard
  namespace: monit
spec:
  ports:
    - port: 80
      targetPort: 9090
  selector:
    k8s-app: kubernetes-dashboard

---

kind: Deployment
apiVersion: apps/v1
metadata:
  labels:
    k8s-app: kubernetes-dashboard
  name: kubernetes-dashboard
  namespace: monit
spec:
  replicas: 1
  revisionHistoryLimit: 10
  selector:
    matchLabels:
      k8s-app: kubernetes-dashboard
  template:
    metadata:
      labels:
        k8s-app: kubernetes-dashboard
    spec:
      containers:
        - name: kubernetes-dashboard
          image: kubernetesui/dashboard:v2.0.0-beta8
          imagePullPolicy: Always
          ports:
            - containerPort: 9090
              protocol: TCP
          args:
            - --namespace=monit
            - --insecure-bind-address=0.0.0.0
            - --insecure-port=9090
            - --enable-insecure-login
            # Uncomment the following line to manually specify Kubernetes API server Host
            # If not specified, Dashboard will attempt to auto discover the API server and connect
            # to it. Uncomment only if the default does not work.
            # - --apiserver-host=http://my-address:port
          volumeMounts:
            - name: kubernetes-dashboard-certs
              mountPath: /certs
              # Create on-disk volume to store exec logs
            - mountPath: /tmp
              name: tmp-volume
          livenessProbe:
            httpGet:
              scheme: HTTP
              path: /
              port: 9090
            initialDelaySeconds: 30
            timeoutSeconds: 30
          securityContext:
            allowPrivilegeEscalation: false
            readOnlyRootFilesystem: true
            runAsUser: 1001
            runAsGroup: 2001
      volumes:
        - name: kubernetes-dashboard-certs
          secret:
            secretName: kubernetes-dashboard-certs
        - name: tmp-volume
          emptyDir: {}
      serviceAccountName: kubernetes-dashboard
      nodeSelector:
        "beta.kubernetes.io/os": linux
      # Comment the following tolerations if Dashboard must not be deployed on master
      tolerations:
        - key: node-role.kubernetes.io/master
          effect: NoSchedule
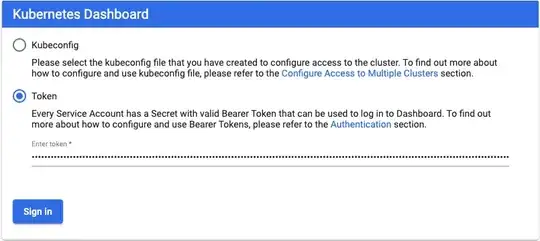
I;ve also a valid token which I can use to access kubernetes dashboard when I use ClusterIP. However when I access it through ngress I cannot go over the login page even with valid token (see screenshot).
I looked into Nginx logs for problems/errors but everything seemed fine
$ kubectl logs -n monit ingress-nginx-controller-bbdc786b4-6nl9h  -f
192.168.65.3 - - [03/Jun/2020:02:03:13 +0000] "GET /api/v1/csrftoken/login HTTP/1.1" 200 85 "http://kubernetes-dashboard.localhost/" "Mozilla/5.0 (Macintosh; Intel Mac OS X 10_15_5) AppleWebKit/537.36 (KHTML, like Gecko) Chrome/83.0.4103.61 Safari/537.36" 479 0.001 [monit-kubernetes-dashboard-80] [] 10.1.0.123:9090 85 0.001 200 59fc952888dfadf0223740c31e562ef8
192.168.65.3 - - [03/Jun/2020:02:03:13 +0000] "POST /api/v1/login HTTP/1.1" 200 1508 "http://kubernetes-dashboard.localhost/" "Mozilla/5.0 (Macintosh; Intel Mac OS X 10_15_5) AppleWebKit/537.36 (KHTML, like Gecko) Chrome/83.0.4103.61 Safari/537.36" 1545 0.005 [monit-kubernetes-dashboard-80] [] 10.1.0.123:9090 1508 0.005 200 241388246b11031765557475bea603ff
192.168.65.3 - - [03/Jun/2020:02:03:13 +0000] "GET /api/v1/plugin/config HTTP/1.1" 200 185 "http://kubernetes-dashboard.localhost/" "Mozilla/5.0 (Macintosh; Intel Mac OS X 10_15_5) AppleWebKit/537.36 (KHTML, like Gecko) Chrome/83.0.4103.61 Safari/537.36" 477 0.003 [monit-kubernetes-dashboard-80] [] 10.1.0.123:9090 185 0.003 200 45371469793ce4f35c45dec70530bea0
192.168.65.3 - - [03/Jun/2020:02:03:13 +0000] "GET /api/v1/login/status HTTP/1.1" 200 108 "http://kubernetes-dashboard.localhost/" "Mozilla/5.0 (Macintosh; Intel Mac OS X 10_15_5) AppleWebKit/537.36 (KHTML, like Gecko) Chrome/83.0.4103.61 Safari/537.36" 476 0.001 [monit-kubernetes-dashboard-80] [] 10.1.0.123:9090 108 0.001 200 49171f5e9316a2d6da883d1c4f0b50df
192.168.65.3 - - [03/Jun/2020:02:03:13 +0000] "GET /api/v1/login/status HTTP/1.1" 200 108 "http://kubernetes-dashboard.localhost/" "Mozilla/5.0 (Macintosh; Intel Mac OS X 10_15_5) AppleWebKit/537.36 (KHTML, like Gecko) Chrome/83.0.4103.61 Safari/537.36" 476 0.001 [monit-kubernetes-dashboard-80] [] 10.1.0.123:9090 108 0.001 200 c69b9d166f1527f00e7cd175696ec8c7
192.168.65.3 - - [03/Jun/2020:02:03:13 +0000] "GET /api/v1/login/status HTTP/1.1" 200 108 "http://kubernetes-dashboard.localhost/" "Mozilla/5.0 (Macintosh; Intel Mac OS X 10_15_5) AppleWebKit/537.36 (KHTML, like Gecko) Chrome/83.0.4103.61 Safari/537.36" 476 0.001 [monit-kubernetes-dashboard-80] [] 10.1.0.123:9090 108 0.001 200 1f9c27ca407bca57dcc0c26bca65be58
What am I missing in my ingress configuration?
UPDATE: I tried to setup an https ingress for the dashboard with this config
apiVersion: extensions/v1beta1
kind: Ingress
metadata:
  name: https-ingress-monit
  annotations:
    nginx.ingress.kubernetes.io/backend-protocol: "HTTPS"
spec:
  rules:
  - host: kubernetes-dashboard.localhost
    http:
      paths:
      - path: /
        backend:
          serviceName: kubernetes-dashboard
          servicePort: 443
But this does not seem to work, no endpoint is configured
$ kubectl describe ingress https-ingress-monit -n monit
Name:             https-ingress-monit
Namespace:        monit
Address:          localhost
Default backend:  default-http-backend:80 (<error: endpoints "default-http-backend" not found>)
Rules:
  Host                            Path  Backends
  ----                            ----  --------
  kubernetes-dashboard.localhost
                                  /   kubernetes-dashboard:443 (<error: endpoints "kubernetes-dashboard" not found>)
Annotations:                      nginx.ingress.kubernetes.io/backend-protocol: HTTPS
Events:
  Type    Reason  Age   From                      Message
  ----    ------  ----  ----                      -------
  Normal  CREATE  87s   nginx-ingress-controller  Ingress monit/https-ingress-monit
  Normal  UPDATE  74s   nginx-ingress-controller  Ingress monit/https-ingress-monit
Now when I try to access http://kubernetes-dashboard.localhost/ I see 503 Service Temporarily Unavailable
