Our setup includes:
- a few Debian 9.12 nodes with Prometheus node_exporter v. 0.18.1 installed as service
- Prometheus server v. 2.14.0 (on Windows Server 2016) scraping the metrics from nodes
- Grafana visualizing metrics
Basically, our load could be volatile so we'd like to capture details so currently we are scraping metrics every 10 seconds, and display 1-minute rates in Grafana, with queries like that:
rate(node_network_receive_bytes_total{instance=~'$node',device!~'tap.*|veth.*|br.*|docker.*|virbr*|lo*'}[1m])*8
In Grafana we see huge spikes, for network instances with average throughput under 100Mbit/s, spikes exceed hundreds of Gigabits per second which obviously is not exactly technically possible. Same happens for CPU load, CPU wait time, disks iops and other node_exporter metrics as well, generally it looks like that, see the dramatic difference between averages and maximums:
Apparently this happens because Prometheus seems to 'miss' single points of data, and based on how rate works it compares 'last' point with zero to current node_network_receive_bytes_total accumulated since last startup and rockets up the output. If we try to switch to irate the spikes just jump even higher which seems to prove our guess.
Querying our Prometheus collerting server for datapoints in particular time ranges where our rate is having spikes, we do not see any zeroed points, data in 'spiky' time range looks like consecutive increase:
node_network_receive_bytes_total{device="ens8",instance="cassandra-xxxxxxxxx0:9100",job="cassandra-xxxxxxxxx"}
3173659836137 @1585311247.489
3173678570634 @1585311257.49
3173696782823 @1585311267.491
3173715943503 @1585311277.492
3173715937480 @1585311277.493
3173731328095 @1585311287.495
3173743034248 @1585311297.502
3173756482486 @1585311307.497
3173775999916 @1585311317.497
3173796096167 @1585311327.498
3173814354877 @1585311337.499
3173833456218 @1585311347.499
3173852345655 @1585311357.501
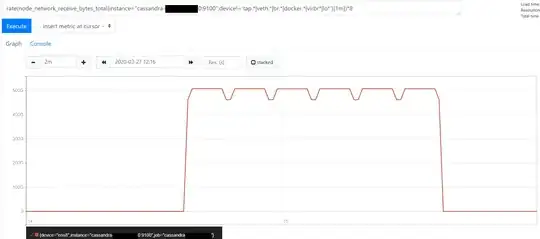
Same on graph:
rate query rate(node_network_receive_bytes_total{instance="cassandra-xxxxxxxxx0:9100",device!~'tap.*|veth.*|br.*|docker.*|virbr*|lo*'}[1m])*8 is displaying surprisingly different picture in the same time range:
While Prometheus documentation states that it should extrapolate missing datapoints, as well as certain issues with rate/irate are widely recognized, for now we're pretty confused with the above.
Our biggest problem is that the spikes make both visualizing and, more importantly, setting up the limits/alerts impossible.
For now we're only certain that Grafana is out of question and the issue lies within our Prometheus, and the question goes like - have you bumped into something similar, maybe? If yes, how do you deal with that?
If not, maybe you could suggest some further dignostic approach?
Anyway, thank you everybody at least for reading until this point.


