United States presidential approval rating
In the United States, presidential job approval ratings were introduced by George Gallup in the late 1930s (estimated to be 1937) to gauge public support for the president of the United States during their term. An approval rating is a percentage determined by a polling which indicates the percentage of respondents to an opinion poll who approve of a particular person or program. Typically, an approval rating is given to a politician based on responses to a poll in which a sample of people are asked whether they approve or disapprove of that particular political figure. A question might ask:
- Do you approve or disapprove of the way that the current president is handling their job as president?[1]
Like most surveys that measure opinions, individual poll results may be inaccurate. Many unscientific approval rating systems exist that show inaccurate statistics. Examples that self select, such as online questions are of this type. However, the aggregate approval rating is generally accepted by statisticians, as a statistically valid indicator of the comparative changes in the popular United States mood regarding a president.
President Donald Trump in 2018 had a job approval of approximately 81–91% with Republicans, 30–42% with Independents, and 5–13% with Democrats.[1] Gallup polling has found that, as of 2019, 47% of Americans are either "Democrats or Democratic leaners" while 42% are either "Republicans or Republican leaners".[2]
President Donald Trump
Most recent polls for President Donald Trump[3][4][5]
| Polling group | Date | Approval | Disapproval | Unsure | Net +/− | Sample size[5] | Population[5][6] |
|---|---|---|---|---|---|---|---|
| YouGov[7] | August 13-15, 2020 | 43% | 55% | 2% | –12% | 781 | Registered Voters |
| Wall Street Journal[8] | August 9-12, 2020 | 44% | 53% | 3% | –9% | 900 | Registered Voters |
| YouGov[9] | August 10, 2020 | 41% | 53% | 6% | –13% | 1,000 | All adults |
| Rasmussen Reports [lower-alpha 1][12] | August 6–10, 2020 | 48% | 51% | 1% | –2% | 1,500 | Likely voters |
| Morning Consult[13] | August 4–7, 2020 | 38% | 57% | 5% | –19% | 2,200 | All adults |
| Georgetown University[14] | August 1–6, 2020 | 42% | 55% | 3% | –13% | 1,000 | Likely voters |
| Research Co.[15] | August 3–4, 2020 | 43% | 54% | 3% | –11% | 1,200 | All adults |
| Reuters/Ipsos[16] | August 3–4, 2020 | 39% | 57% | 4% | –18% | 1,115 | All adults |
| Global Strategy Group/GBAO (Navigator Research)[17] | July 30–August 3, 2020 | 39% | 59% | 2% | –20% | 1,407 | Registered voters |
| Pew Research Center[18] | July 27–August 2, 2020 | 38% | 59% | 3% | –21% | 11,001 | All adults |
| Emerson College/Nexstar Media[19] | July 29–30, 2020 | 45% | 51% | 4% | –6% | 964 | Likely voters |
| Investor's Business Daily/TIPP[20] | July 25–28, 2020 | 39% | 54% | 7% | –15% | 1,212 | All adults |
| 0ptimus[21] | July 24–28, 2020 | 42% | 58% | 0% | –16% | 1,039 | All adults |
| Change Research/CNBC[22] | July 24–26, 2020 | 44% | 56% | 0% | –12% | 1,039 | Likely voters |
| The Hill/HarrisX[23] | July 24–26, 2020 | 44% | 56% | 0% | –12% | 2,842 | Registered voters |
| RMG Research[lower-alpha 2][24] | July 23–25, 2020 | 40% | 57% | 3% | –17% | 1,200 | Registered voters |
| Zogby Analytics[25] | July 21–23, 2020 | 47% | 51% | 2% | –4% | 1,516 | Likely voters |
| Harvard/Harris[26] | July 21–23, 2020 | 44% | 56% | 0% | –12% | 1,932 | Registered voters |
| Gallup poll[27] | July 1–23, 2020 | 41% | 56% | 3% | –15% | 1,007 | All adults |
| Echelon Insights[28] | July 17–22, 2020 | 37% | 60% | 3% | –23% | 1,000 | Likely voters |
| American Research Group[29] | July 17–20, 2020 | 36% | 60% | 4% | –24% | 1,100 | All adults |
| Associated Press/NORC[30] | July 16–20, 2020 | 38% | 61% | 1% | –23% | 1,057 | All adults |
| Fox News[lower-alpha 3][31] | July 12–15, 2020 | 45% | 54% | 1% | –9% | 1,104 | Registered voters |
| ABC News/The Washington Post[32] | July 12–15, 2020 | 39% | 57% | 4% | –18% | 1,006 | All adults |
| Quinnipiac[33] | July 9–13, 2020 | 36% | 60% | 4% | –24% | 1,273 | Registered voters |
| NBC News/The Wall Street Journal[34] | July 9–12, 2020 | 42% | 56% | 2% | –14% | 900 | Registered voters |
Historical comparison
Historical Gallup Poll approval highs and lows for each president since 1937[35][36][37][lower-alpha 4]
| Order | President | Highest approval | Lowest approval | High – Low |
Highest disapproval | Highest margin | Lowest margin | Final poll | Approval average[35] |
Polls per year |
|---|---|---|---|---|---|---|---|---|---|---|
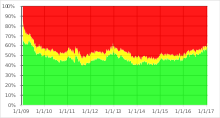
| 45[38][39][40][41] | Trump | 49 (2020-01-29, 2020-02-16, 2020-03-22, 2020-04-28, 2020-05-13)[38] | 35 (2017-8-27, 2017-10-29, 2017-12-03, 2017-12-17)[38] | 14 | 60 (2017-8-27, 2017-10-29, 2017-12-17, 2018-11-25) [38] | 4 (2020-03-22) [38] | −25 (2017-10-29, 2017-12-01) [38] | 41 (2020-07-23)[38] | 40 [38] | 40 |
| 44[42][43] | Obama | 67 (2009-01-25) | 40 (2014-09-05)[lower-alpha 5] | 27 | 55 (2014-06-22, 2014-10-12) | 56 (2009-01-23, 2009-01-24) | −18 (2014-10-10) | 59 (2017-01-19) | 47.9 | 48.4 |
| 43[44] | G. W. Bush | 90 (2001-9-21) | 25 (2008-10-05, 2008-10-12, 2008-11-02) | 65 | 71 (2008-10-10) | 83 (2001-09-22) | −46 (2008-10-12) | 34 (2009-01-11) | 49.4 | 33.7 |
| 42[45] | Clinton | 73 (1998-12-19) | 37 (1993-06-06) | 36 | 54 (1994-09-07) | 45 (2000-12-17) | −14 (1994-09-07) | 66 (2001-01-14) | 55.1 | 28.5 |
| 41[46] | G. H. W. Bush | 89 (1991-02-28) | 29 (1992-08-02, 1992-10-13) | 60 | 60 (1992-07-31) | 82 (1991-03-03) | −30 (1992-08-02, 1992-10-13) | 56 (1993-01-11) | 60.9 | 39.5 |
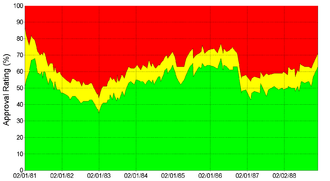
| 40[47] | Reagan | 71 (1986-01-30) | 35 (1983-01-31) | 36 | 56 (1983-01-28) | 52 (1986-01-30) | −21(1983-01-31) | 63 (1988-12-29) | 52.8 | 37.0 |
| 39[48] | Carter | 74 (1977-03-15) | 28 (1979-06-26, 1979-10-02) | 46 | 59 (1979-06-26) | 66 (1977-03-15) | −31 (1979-06-26) | 34 (1980-12-08) | 45.5 | 22.7 |
| 38[49] | Ford | 70 (1974-08-13) | 36 (1975-03-25) | 34 | 46 (1975-04-15, 1975-11-18) | 67 (1974-08-13) | −7 (1975-02-25, 1975-03-25, 1975-04-15) | 53 (1976-12-13) | 47.2 | 14.7 |
| 37[50] | Nixon | 66 (1973-01-23) | 24 (1974-01-02) | 42 | 66 (1974-08-05) | 57 (1969-03-17) | −42 (1974-08-05) | 24 (1974-08-05) | 49.1 | 17.7 |
| 36[51] | Johnson | 79 (1964-03-05) | 34 (1968-08-12) | 45 | 52 (1968-08-12) | 75 (1963-12-10) | −18 (1968-08-12) | 49 (1969-01-06) | 55.1 | 15.3 |
| 35[52] | Kennedy | 83 (1962-03-05) | 56 (1963-09-10) | 27 | 30 (1963-09-12, 1963-11-08) | 78 (1962-03-05) | 27 (1963-09-10) | 58 (1963-11-13) | 70.1 | 13.7 |
| 34[53] | Eisenhower | 77 (1955-11-22, 1956-12-19) | 47 (1958-03-25) | 30 | 36 (1958-03-25) | 66 (1953-04-02, 1956-12-19) | 12 (1958-03-25) | 59 (1960-12-13) | 65.0 | 14.4 |
| 33[54] | Truman | 87 (1945-06-05) | 22 (1951-11-16, 1952-02-14) | 69 | 67 (1952-01-06) | 85 (1945-08-22) | −43 (1952-01-04) | 32 (1952-12-16) | 45.4 | 8.4 |
| 32[55] | F. D. Roosevelt | 83 (1942-01-23) | 48 (1939-08-18) | 35 | 46 (1938-05-22, 1938-05-29, 1938-11-07) | 73 (1942-01-23) | 65 (1943-12-15) | 63 | 8 |
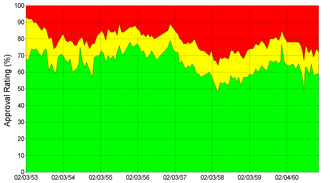
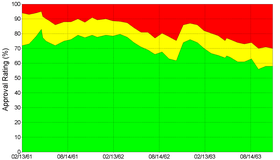
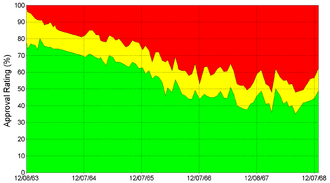
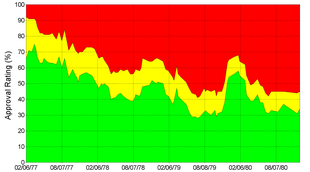
Graphs
| Gallup Poll graphs of approval ratings for presidents of the United States |
|


See also
- Historical rankings of Presidents of the United States
- Opinion polling on the Donald Trump administration
Notes
- Polls with a notable pro-Trump/Republican bias.[10][11]
- conducted by Scott Rasmussen, founder and President of Rasmussen Reports from 2003 to 2013.
- Conducted by Beacon Research (D) and Shaw & Company Research (R)
- Only the results of Gallup polls are included as no other poll results exist for presidents before President Clinton.
- Last of eight, sometimes overlapping, 3-day averages.
References
- "Presidential Approval Ratings – Donald Trump". Gallup. Retrieved February 13, 2017.
- Jeffrey M. Jones (January 7, 2020). "U.S. Party Preferences Steady During Trump Era". Gallup. Retrieved January 23, 2020.
- "President Trump: Job Ratings". PollingReport.com. Retrieved August 23, 2019.
- "President Trump Job Approval". RealClearPolitics. Retrieved December 26, 2018.
- "How (un)popular is Donald Trump?". fivethirtyeight.com. Retrieved December 26, 2018.
- Kennedy, Courtney; Deane, Claudia (February 16, 2017). "A Basic Question when Reading a Poll: Does It Include or Exclude Nonvoters?". Pew Research Center.
- "Donald Trump Approval Daily". August 13–15, 2020.
- (PDF). August 9–12, 2020 https://assets.documentcloud.org/documents/7037941/200438-NBCWSJ-August-Poll-8-16-20-Release.pdf. Missing or empty
|title=(help) - "Donald Trump Approval Daily". August 8–10, 2020.
- Blake, Aaron (September 17, 2012). "Rasmussen: The GOP's Cure for the Common Poll". The Washington Post.
- Sheffield, Matthew (September 10, 2018). "Pollster: Rasmussen Research Has a pro-GOP Bias". The Hill.
- "Trump Approval Index History". August 11, 2020.
- "National Tracking Poll #200816" (PDF). August 4–7, 2020.
- "Battleground 66 #16639: Weighted Tables". The Tarrance Group. August 1–6, 2020.
- Canseco, Mario (August 5, 2020). "Most Americans Think Worst of COVID-19 Pandemic Lies Ahead".
- "Core Political Data" (PDF). August 5, 2020.
- "Navigator Daily Tracker" (PDF). July 30 – August 3, 2020.
- "Views of COVID-19 response by Trump, hospitals, CDC and other officials". August 6, 2020.
- "July National Poll: Biden Maintains Lead in Presidential Race; Majority Support Nationwide Mask Mandate in Public Spaces". July 29–30, 2020.
- "IBD/TIPP National Poll". July 25–28, 2020.
- "Optimus Coronavirus Tracking: Crosstabs Report" (PDF). July 24–28, 2020.
- "States of Play: Battleground & National Surveys on COVID-19, Vaccines, and Economic Relief". July 29, 2020.
- Schulte, Gabriela (July 29, 2020). "Poll: Trump approval rating dips amid surging COVID-19 cases, deaths". The Hill.
- Sheffield, Carrie (July 28, 2020). "With fewer than 100 days before election, Trump's approval rating at 40%, down from 42% in June". Just the News.
- "Donald Trump Job Approval Table". July 30, 2020.
- "Monthly Harvard-Harris Poll: July 2020" (PDF). July 21–23, 2020.
- Brenan, Megan (July 30, 2020). "Congress' Approval Drops to 18%, Trump's Steady at 41%".
- "Verified Voter Omnibus Survey" (PDF). July 17–22, 2020.
- "Trump Job Approval Down". July 21, 2020.
- "The July 2020 AP–NORC Center Poll" (PDF). July 16–20, 2020.
- "Fox News Poll" (PDF). July 19, 2020.
- "Washington Post/ABC Poll". July 12–15, 2020.
- "Biden Widens Lead Over Trump To 15 Points In Presidential Race, Quinnipiac University National Poll Finds; Trump Job Approval Rating Drops To 36 Percent". July 15, 2020.
- "Study #200356: NBC News/Wall Street Journal Survey" (PDF). July 9–12, 2020.
- "Presidential Approval Ratings – Gallup Historical Statistics and Trends". Gallup. Retrieved August 16, 2011.
- Lydia Saad (March 29, 2017). "Trump's Approval Rating Unusually Low, Unusually Early". Gallup. Retrieved April 1, 2017.
- The American Presidency Project at UC Santa Barbara.
- "Gallup Daily: Trump Job Approval". Gallup. Retrieved January 27, 2017.
- "Trump Job Approval (Weekly)". Gallup. Retrieved January 22, 2018.
- "Presidential Approval Ratings -- Donald Trump". Gallup. Retrieved October 9, 2018.
- Jeffrey M. Jones (April 24, 2018). "Trump's Fifth-Quarter Job Approval Up; Still Historically Low". Gallup.
- Graphical display and numbers of Gallup "daily tracking" polls
- "Presidential Approval Ratings -- Barack Obama".
- "Gallup.com". Gallup.com. Retrieved August 16, 2011.
- "Presidential Approval Ratings -- Bill Clinton". gallup.com. Retrieved January 26, 2017.
- "Presidential Job Approval for George H. W. Bush". American Presidency Project.
- "Presidential Job Approval for Ronald Reagan". American Presidency Project.
- "Presidential Job Approval for Jimmy Carter". American Presidency Project.
- "Presidential Job Approval for Gerald Ford". American Presidency Project.
- "Presidential Job Approval for Richard Nixon". American Presidency Project.
- "Presidential Job Approval for Lyndon B. Johnson". American Presidency Project.
- "Presidential Job Approval for John F. Kennedy". American Presidency Project.
- Presidential Job Approval for "Dwight D. Eisenhower". American Presidency Project.
- "Presidential Job Approval for Harry S. Truman". American Presidency Project.
- "Presidential Job Approval for Franklin D. Roosevelt". American Presidency Project.
External links
- "Historical Presidential Job Performance Ratings". Roper Center.
- "Trump approval ratings". FiveThirtyEight.
- "Midterm Presidential Approval Ratings". Data360.
- "President Job Approval Ratings". PresidentPollsUSA.
- "Historical Presidential Approval Ratings 1945–2009". The Wall Street Journal.
- "President Obama's Ongoing Job Approval". (CongressRatings)
| Presidents | |
|---|---|
| Professional careers | |
| Personal life | |
| Vice presidents | |
| Succession | |
| Elections | |
| Candidates |
|
| Families | |
| Namesakes, honors | |
| In fiction | |
| |