United States influenza statistics by flu season
US influenza statistics by flu season. From the Centers for Disease Control and Prevention page called "Disease Burden of Influenza": "Each year CDC estimates the burden of influenza in the U.S. CDC uses modeling to estimate the number of influenza illnesses, medical visits, flu-associated hospitalizations, and flu-associated deaths that occur in the U.S. in a given season. The methods used to calculate these estimates are described on CDC’s webpage, How CDC Estimates the Burden of Seasonal Influenza in the U.S."[1][2]
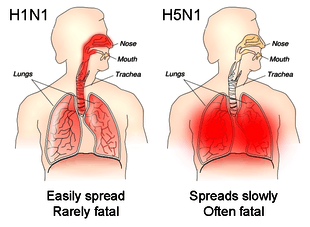
The different sites of infection (shown in red) of seasonal H1N1 versus avian H5N1. This influences their lethality and ability to spread.
Hospitalizations and deaths
- UI = uncertainty interval.
*2017–2018 and 2018–2019 are preliminary estimates.
| Season | Deaths |
|---|---|
| 2010–2011 | 37,000 |
| 2011–2012 | 12,000 |
| 2012–2013 | 43,000 |
| 2013–2014 | 38,000 |
| 2014–2015 | 51,000 |
| 2015–2016 | 23,000 |
| 2016–2017 | 38,000 |
| 2017–2018* | 61,000 |
| 2018–2019* | 34,000 |
| Season | Hospitalizations | Deaths | ||
|---|---|---|---|---|
| Estimate | 95% UI | Estimate | 95% UI | |
| 2010 – 2011 | 290,000 | (270,000 – 350,000) | 37,000 | (32,000 – 51,000) |
| 2011 – 2012 | 140,000 | (130,000 – 190,000) | 12,000 | (11,000 – 23,000) |
| 2012 – 2013 | 570,000 | (530,000 – 680,000) | 43,000 | (37,000 – 57,000) |
| 2013 – 2014 | 350,000 | (320,000 – 390,000) | 38,000 | (33,000 – 50,000) |
| 2014 – 2015 | 590,000 | (540,000 – 680,000) | 51,000 | (44,000 – 64,000) |
| 2015 – 2016 | 280,000 | (220,000 – 480,000) | 23,000 | (17,000 – 35,000) |
| 2016 – 2017 | 500,000 | (380,000 – 860,000) | 38,000 | (29,000 – 61,000) |
| 2017 – 2018* | 810,000 | (620,000 – 1,400,000) | 61,000 | (46,000 – 95,000) |
| 2018 – 2019* | 490,561 | (387,283 – 766,472) | 34,157 | (26,339 – 52,664) |
Symptomatic illnesses and medical visits
- UI = uncertainty interval.
*2017–2018 and 2018–2019 are preliminary estimates.
| Season | Symptomatic Illnesses | Medical Visits | ||
|---|---|---|---|---|
| Estimate | 95% UI | Estimate | 95% UI | |
| 2010 – 2011 | 21,000,000 | (20,000,000 – 25,000,000) | 10,000,000 | (9,300,000 – 12,000,000) |
| 2011 – 2012 | 9,300,000 | (8,700,000 – 12,000,000) | 4,300,000 | (4,000,000 – 5,600,000) |
| 2012 – 2013 | 34,000,000 | (32,000,000 – 38,000,000) | 16,000,000 | (15,000,000 – 18,000,000) |
| 2013 – 2014 | 30,000,000 | (28,000,000 – 33,000,000) | 13,000,000 | (12,000,000 – 15,000,000) |
| 2014 – 2015 | 30,000,000 | (29,000,000 – 33,000,000) | 14,000,000 | (13,000,000 – 16,000,000) |
| 2015 – 2016 | 24,000,000 | (20,000,000 – 33,000,000) | 11,000,000 | (9,000,000 – 15,000,000) |
| 2016 – 2017 | 29,000,000 | (25,000,000 – 45,000,000) | 14,000,000 | (11,000,000 – 23,000,000) |
| 2017 – 2018* | 45,000,000 | (39,000,000 – 58,000,000) | 21,000,000 | (18,000,000 – 27,000,000) |
| 2018 – 2019* | 35,520,883 | (31,323,881 – 44,995,691) | 16,520,350 | (14,322,767 – 21,203,231) |
See also
- Influenza pandemic
- 2009 swine flu pandemic
- COVID-19 pandemic in the United States. Statistics section.
- Template:2019–20 coronavirus pandemic data. Flu statistics are often compared to coronavirus statistics.
- COVID-19 pandemic cases. More statistics for comparison purposes.
- COVID-19 pandemic deaths. More statistics for comparison purposes.
- Influenza vaccine
- Bird flu
- Human flu
- Swine flu
- Horse flu
- Dog flu
- Freshers' flu
- 2012–2013 flu season
- 2017–2018 United States flu season
- 2019–2020 United States flu season
References
- Disease Burden of Influenza. Centers for Disease Control and Prevention, National Center for Immunization and Respiratory Diseases (NCIRD)
- "What you need to know about influenza (flu) from CDC". Centers for Disease Control and Prevention. National Center for Immunization and Respiratory Diseases (NCIRD).
This article is issued from Wikipedia. The text is licensed under Creative Commons - Attribution - Sharealike. Additional terms may apply for the media files.