Social Progress Index
The Social Progress Index (SPI) measures the extent to which countries provide for the social and environmental needs of their citizens. Fifty-four indicators in the areas of basic human needs, foundations of well-being, and opportunity to progress show the relative performance of nations. The index is published by the nonprofit Social Progress Imperative, and is based on the writings of Amartya Sen, Douglass North, and Joseph Stiglitz.[1] The SPI measures the well-being of a society by observing social and environmental outcomes directly rather than the economic factors. The social and environmental factors include wellness (including health, shelter and sanitation), equality, inclusion, sustainability and personal freedom and safety.[2]
Introduction and methodology
The index combines three dimensions
- Basic human needs
- Foundations of well-being
- Opportunity
Each dimension includes four components, which are each composed of between three and five specific outcome indicators. The included indicators are selected because they are measured appropriately, with a consistent methodology, by the same organization across all (or essentially all) of the countries in the sample. Together, this framework aims to capture a broad range of interrelated factors revealed by the scholarly literature and practitioner experience as underpinning social progress.
Two key features of the Social Progress Index are:[2]
- the exclusion of economic variables
- the use of outcome measures rather than inputs
Social Progress Imperative evaluated hundreds of possible indicators while developing the Social Progress Index, including engaging researchers at MIT to determine what indicators best differentiated the performance of nations. The index uses outcome measures when there are sufficient data available or the closest possible proxies.[2]
History
In 2010, a group of global leaders from the social sector sought to develop a better measure of a country's level of development and, by extension, better understand its development priorities. Funded by private foundations and under the technical guidance of Professors Michael Porter from Harvard Business School and Scott Stern from the Massachusetts Institute of Technology, the group formed Social Progress Imperative and launched a beta version of the Social Progress Index for 50 countries in 2013 to measure a comprehensive array of components of social and environmental performance and aggregate them into an overall framework.
This work was influenced by the contributions of Amartya Sen on social development, as well as by the recent call for action in the report Mismeasuring Our Lives by the Commission on the Measurement of Economic Performance and Social Progress.[3] The Social Progress Index was released in 2014 for 133 countries with a second version in 2015.[2]
On 11 July 2013, Social Progress Imperative's chairman and professor at Harvard Business School, Michael Porter, addressed the United Nations 6th Ministerial Forum for Development and discussed the Social Progress Index.[2]
In addition to the global Social Progress Index, the methodology used to create it has been adapted to measure social and environmental performance in smaller areas, such as the Amazon region of Brazil.[4] Other projects include a Social Progress Index for the Municipality of Guatemala City.[5] Fundacion Paraguaya has integrated elements of the Social Progress Index into its Poverty Stoplight tool. The national government of Paraguay is setting a target for Social Progress Index performance alongside GDP targets.
The Guardian reported that the European Commission had agreed to partner with Social Progress Imperative to create a social progress index for the European Union.[6] The EU Social Progress Index was published in October, 2016.
A similar index, although with some differences compared to the nation list (and therefore not directly comparable), has been published for the individual U.S. states.[7][8]
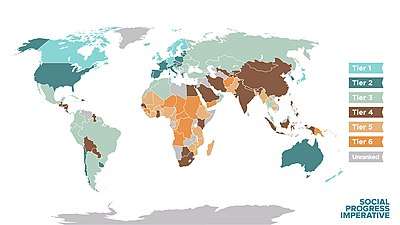
2019 Rankings and scores by country
Color key:
Very high → Tier 1 Tier 2 Tier 3 Tier 4 Tier 5 Tier 6 → Very low
| Country | 2019[9] | ||||
|---|---|---|---|---|---|
| Rank | Score | Basic Human Needs | Foundation of Well Being | Opportunity | |
| 1 | 90.95 | 96.89 | 92.32 | 83.64 | |
| 2 | 90.09 | 96.51 | 90.18 | 83.59 | |
| 3 | 89.89 | 96.98 | 91.14 | 81.55 | |
| 4 | 89.56 | 96.10 | 89.25 | 83.33 | |
| 5 | 89.45 | 96.39 | 89.88 | 82.08 | |
| 6 | 89.29 | 98.30 | 87.91 | 81.66 | |
| 7 | 88.93 | 96.98 | 88.55 | 81.25 | |
| 8 | 88.84 | 95.75 | 87.70 | 83.06 | |
| 9 | 88.81 | 96.80 | 88.36 | 81.29 | |
| 10 | 88.34 | 97.72 | 91.04 | 76.26 | |
| 11 | 88.31 | 96.74 | 88.30 | 79.88 | |
| 12 | 88.02 | 95.88 | 86.40 | 81.79 | |
| 13 | 87.98 | 94.63 | 89.05 | 80.28 | |
| 14 | 87.97 | 94.89 | 88.93 | 80.10 | |
| 15 | 87.79 | 94.44 | 90.72 | 78.20 | |
| 16 | 87.66 | 94.79 | 90.56 | 77.62 | |
| 17 | 87.47 | 94.77 | 90.34 | 77.30 | |
| 18 | 87.12 | 95.81 | 87.43 | 78.12 | |
| 19 | 86.77 | 93.89 | 87.29 | 79.12 | |
| 20 | 86.40 | 96.38 | 87.41 | 75.42 | |
| 21 | 85.80 | 95.64 | 86.18 | 75.58 | |
| 22 | 85.69 | 92.32 | 88.64 | 76.12 | |
| 23 | 85.61 | 96.87 | 86.08 | 73.90 | |
| 24 | 84.36 | 95.85 | 82.52 | 74.72 | |
| 25 | 83.98 | 91.91 | 85.79 | 74.25 | |
| 26 | 83.62 | 91.64 | 82.05 | 77.17 | |
| 27 | 83.23 | 98.39 | 85.05 | 66.24 | |
| 28 | 83.14 | 93.10 | 86.84 | 69.48 | |
| 29 | 82.63 | 92.99 | 87.95 | 66.95 | |
| 30 | 82.48 | 92.82 | 83.08 | 71.53 | |
| 31 | 81.44 | 93.58 | 84.46 | 66.27 | |
| 32 | 81.30 | 90.44 | 81.67 | 71.78 | |
| 33 | 81.25 | 94.11 | 81.00 | 68.65 | |
| 34 | 80.65 | 88.48 | 83.66 | 69.80 | |
| 35 | 80.43 | 94.04 | 80.97 | 80.97 | |
| 36 | 80.42 | 89.93 | 81.03 | 70.30 | |
| 37 | 80.02 | 91.04 | 79.85 | 69.18 | |
| 38 | 79.21 | 90.90 | 80.88 | 65.86 | |
| 39 | 78.77 | 91.77 | 78.38 | 66.17 | |
| 40 | 77.89 | 89.35 | 76.78 | 67.55 | |
| 41 | 77.77 | 88.59 | 77.08 | 67.63 | |
| 42 | 76.86 | 84.43 | 76.11 | 70.05 | |
| 43 | 76.17 | 89.59 | 75.30 | 63.61 | |
| 44 | 74.88 | 91.30 | 72.60 | 60.75 | |
| 45 | 74.81 | 87.60 | 74.66 | 62.19 | |
| 46 | 74.17 | 89.11 | 76.34 | 57.06 | |
| 47 | 73.96 | 84.52 | 78.92 | 58.44 | |
| 48 | 73.90 | 90.16 | 73.49 | 58.06 | |
| 49 | 72.87 | 81.79 | 76.56 | 60.26 | |
| 50 | 72.58 | 81.30 | 68.80 | 67.65 | |
| 51 | 72.33 | 86.56 | 71.00 | 59.42 | |
| 52 | 71.88 | 82.57 | 77.01 | 56.05 | |
| 53 | 71.59 | 86.00 | 70.97 | 57.81 | |
| 54 | 71.57 | 85.03 | 79.03 | 50.65 | |
| 55 | 71.51 | 82.31 | 74.67 | 57.54 | |
| 56 | 71.34 | 84.59 | 73.28 | 73.28 | |
| 57 | 71.31 | 80.06 | 78.63 | 55.22 | |
| 58 | 71.16 | 84.95 | 76.88 | 51.66 | |
| 59 | 71.14 | 87.97 | 73.52 | 73.52 | |
| 60 | 70.31 | 81.25 | 78.55 | 51.12 | |
| 61 | 69.84 | 89.29 | 70.92 | 49.31 | |
| 62 | 69.71 | 83.89 | 72.40 | 52.83 | |
| 63 | 69.57 | 88.90 | 69.24 | 50.59 | |
| 64 | 69.37 | 93.07 | 71.26 | 43.78 | |
| 65 | 69.09 | 78.66 | 77.52 | 51.08 | |
| 66 | 69.08 | 88.25 | 72.80 | 46.20 | |
| 67 | 68.92 | 86.37 | 72.81 | 47.57 | |
| 68 | 68.55 | 77.77 | 68.99 | 68.99 | |
| 69 | 68.20 | 85.39 | 70.36 | 48.84 | |
| 70 | 67.58 | 82.36 | 69.31 | 51.09 | |
| 71 | 67.49 | 85.00 | 69.97 | 47.50 | |
| 72 | 67.47 | 82.07 | 72.66 | 47.69 | |
| 73 | 67.44 | 73.93 | 65.35 | 63.03 | |
| 74 | 67.42 | 87.19 | 65.98 | 49.09 | |
| 75 | 67.27 | 81.38 | 62.30 | 58.14 | |
| 76 | 67.26 | 84.14 | 68.37 | 49.29 | |
| 77 | 67.20 | 81.08 | 69.88 | 50.64 | |
| 78 | 67.15 | 77.14 | 71.14 | 53.16 | |
| 79 | 67.06 | 82.75 | 67.74 | 50.68 | |
| 80 | 66.97 | 82.21 | 64.22 | 54.47 | |
| 81 | 66.64 | 82.43 | 69.36 | 48.11 | |
| 82 | 66.04 | 84.15 | 65.95 | 48.02 | |
| 83 | 65.60 | 72.16 | 65.82 | 58.81 | |
| 84 | 65.58 | 72.48 | 68.07 | 56.20 | |
| 85 | 65.52 | 74.43 | 69.23 | 52.92 | |
| 86 | 65.15 | 84.16 | 68.35 | 42.94 | |
| 87 | 64.98 | 79.94 | 66.17 | 48.82 | |
| 88 | 64.65 | 77.27 | 68.13 | 48.54 | |
| 89 | 64.54 | 81.35 | 68.85 | 43.41 | |
| 90 | 63.95 | 85.62 | 69.21 | 37.01 | |
| 91 | 63.85 | 81.97 | 60.98 | 48.60 | |
| 92 | 63.74 | 78.36 | 61.06 | 51.81 | |
| 93 | 63.66 | 74.64 | 65.75 | 50.59 | |
| 94 | 63.40 | 68.62 | 69.29 | 52.30 | |
| 95 | 61.75 | 63.60 | 66.61 | 55.03 | |
| 96 | 61.71 | 83.20 | 54.85 | 47.09 | |
| 97 | 61.42 | 67.05 | 63.23 | 53.98 | |
| 98 | 60.31 | 71.92 | 63.66 | 63.66 | |
| 99 | 60.23 | 69.23 | 59.36 | 52.09 | |
| 100 | 59.83 | 83.22 | 58.18 | 38.08 | |
| 101 | 59.67 | 70.68 | 66.83 | 41.50 | |
| 102 | 59.10 | 67.72 | 58.94 | 50.63 | |
| 103 | 58.97 | 72.63 | 66.97 | 37.32 | |
| 104 | 58.59 | 66.91 | 61.96 | 46.92 | |
| 105 | 55.80 | 62.10 | 60.52 | 44.77 | |
| 106 | 55.57 | 84.55 | 53.38 | 3.38 | |
| 107 | 54.92 | 75.80 | 59.55 | 29.41 | |
| 108 | 54.11 | 66.41 | 60.03 | 35.88 | |
| 109 | 53.51 | 55.82 | 61.18 | 43.54 | |
| 110 | 52.96 | 57.55 | 61.27 | 40.06 | |
| 111 | 52.90 | 61.22 | 53.69 | 43.80 | |
| 112 | 52.96 | 53.46 | 60.31 | 44.30 | |
| 113 | 52.65 | 62.22 | 56.43 | 56.43 | |
| 114 | 52.04 | 62.00 | 53.19 | 40.94 | |
| 115 | 51.21 | 62.97 | 52.00 | 38.68 | |
| 116 | 51.07 | 47.84 | 55.95 | 41.96 | |
| 117 | 50.56 | 53.49 | 57.48 | 40.72 | |
| 118 | 50.52 | 53.50 | 54.71 | 43.34 | |
| 119 | 50.36 | 59.88 | 59.36 | 31.83 | |
| 120 | 49.34 | 61.63 | 55.32 | 31.07 | |
| 121 | 49.20 | 50.17 | 57.31 | 40.12 | |
| 122 | 49.09 | 47.65 | 56.20 | 43.42 | |
| 123 | 48.58 | 47.84 | 55.95 | 41.96 | |
| 124 | 48.44 | 49.29 | 46.32 | 49.72 | |
| 125 | 48.20 | 58.46 | 48.83 | 37.29 | |
| 126 | 48.05 | 59.68 | 45.17 | 39.28 | |
| 127 | 48.04 | 54.86 | 54.86 | 34.39 | |
| 128 | 47.82 | 45.76 | 56.26 | 41.43 | |
| 129 | 46.95 | 63.39 | 50.12 | 27.34 | |
| 130 | 46.67 | 44.47 | 48.31 | 47.24 | |
| 131 | 46.58 | 46.18 | 57.65 | 35.91 | |
| 132 | 45.98 | 55.76 | 48.93 | 33.26 | |
| 133 | 45.67 | 52.60 | 52.67 | 31.76 | |
| 134 | 45.41 | 49.65 | 54.91 | 31.69 | |
| 135 | 45.39 | 46.01 | 51.77 | 38.39 | |
| 136 | 43.58 | 42.93 | 46.43 | 41.38 | |
| 137 | 42.58 | 49.00 | 45.05 | 33.70 | |
| 138 | 42.45 | 53.37 | 45.51 | 28.45 | |
| 139 | 41.70 | 43.89 | 43.85 | 37.47 | |
| 140 | 41.59 | 54.66 | 45.52 | 24.58 | |
| 141 | 40.59 | 44.49 | 47.78 | 29.48 | |
| 142 | 39.09 | 44.04 | 47.00 | 26.21 | |
| 143 | 38.60 | 51.72 | 38.91 | 25.17 | |
| 144 | 38.59 | 37.12 | 39.37 | 39.29 | |
| 145 | 36.77 | 38.49 | 46.08 | 25.75 | |
| 146 | 31.61 | 40.98 | 33.87 | 19.97 | |
| 147 | 28.79 | 29.65 | 35.57 | 21.15 | |
| 148 | 28.05 | 23.55 | 32.60 | 28.01 | |
| 149 | 24.44 | 32.15 | 26.28 | 14.90 | |
| N/A | N/A | 84.76 | N/A | 32.98 | |
| N/A | N/A | N/A | 72.45 | 37.49 | |
| N/A | N/A | 86.58 | N/A | 49.69 | |
| N/A | N/A | N/A | 78.17 | N/A | |
| N/A | N/A | 61.68 | N/A | 25.53 | |
| N/A | N/A | 73.30 | N/A | 46.83 | |
| N/A | N/A | 43.88 | N/A | N/A | |
| N/A | N/A | 43.71 | N/A | 34.50 | |
| N/A | N/A | 79.49 | N/A | 38.30 | |
| N/A | N/A | N/A | 82.78 | 52.77 | |
| N/A | N/A | 72.38 | N/A | 38.06 | |
| N/A | N/A | 85.33 | N/A | 38.94 | |
| N/A | N/A | 63.10 | N/A | 55.80 | |
| N/A | N/A | 86.14 | 76.36 | N/A | |
| N/A | N/A | N/A | 54.15 | N/A | |
| N/A | N/A | 37.72 | N/A | N/A | |
| N/A | N/A | 84.52 | N/A | 62.48 | |
| N/A | N/A | 48.90 | N/A | 41.34 | |
| N/A | N/A | 66.16 | 55.84 | N/A | |
| N/A | N/A | 80.48 | N/A | 41.19 | |
| N/A | N/A | 51.03 | N/A | 41.61 | |
Criticism
From an econometric stand point, the Index appears to be similar to other efforts aimed at overcoming the limitation of traditional economic measures such as the gross domestic product (GDP). One major criticism is that although the Social Progress Index can be seen as a superset of indicators used by earlier econometric models such as Gross National Well-being Index 2005, Bhutan Gross National Happiness Index of 2012, and World Happiness Report of 2012, unlike them, it ignores measures of subjective life satisfaction and psychological well-being. Other critics point out that "there remain certain dimensions that are currently not included in the SPI. These are the concentration of wealth in the top 1 percent of the population, efficiency of the judicial system, and quality of the transportation infrastructure."[10]
Some critics argue for caution. Though words such as “inclusive capitalism” are now bandied around increasingly to signal a new age, free from ideological battlegrounds between public and private, much of what the organization’s founders say about it confirms that the index is about more “business inclusive” than “inclusive capitalism.”[11]
See also
- Bhutan GNH Index
- Broad measures of economic progress
- Disability-adjusted life year
- Economics
- Green national product
- Gender-related Development Index
- Genuine Progress Indicator
- Gross domestic product
- Gross National Happiness
- Gross National Well-being
- Happiness economics
- Happy Planet Index
- Human Development Index
- Progress (history)
- Progressive utilization theory
- Legatum Prosperity Index
- Leisure satisfaction
- Money-rich, time-poor
- OECD Better Life Index
- Post-materialism
- Psychometrics
- Subjective life satisfaction
- Where-to-be-born Index
- Wikiprogress
- World Happiness Report
- World Values Survey
References
- "Beyond GDP". The Economist. 18 April 2013. Retrieved 2 August 2013.
- "Social Progress Imperitive Website". Social Progress Imperitive. Retrieved 30 October 2015.
- "Beyond GDP". The Economist. 18 April 2013. Retrieved 2 August 2013.
- "Conservation of Amazon threatened by poor social conditions of its people: study". Global Post. Retrieved 22 May 2015.
- "ÍNDICE DE PROGRESO SOCIAL DE LA CIUDAD DE GUATEMALA - Progreso Social". progresosocial.org. Retrieved 22 May 2015.
- Jo Confino. "European Commission agrees to investigate using social progress tool alongside GDP". The Guardian. Retrieved 22 May 2015.
- "Social Progress Index: US States – Methodology Summary" (PDF). Social Progress Imperative. 2018. Retrieved 16 April 2018.
- "State Progress Reports". Social Progress Imperative. 2018. Retrieved 16 April 2018.
- https://www.socialprogress.org/
- http://opinion.inquirer.net/80526/social-progress-index
- http://www.humanosphere.org/social-business/2016/05/a-new-index-to-measure-social-progress-but-what-is-it-really-telling-us/