Pennsylvania House of Representatives, District 166
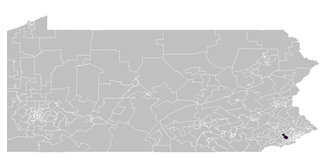
The 166th Pennsylvania House of Representatives District is in South Eastern Pennsylvania and has been represented by Greg Vitali since 1993.
 | |
| Current | Greg Vitali (D–Haverford) |
|---|---|
| Demographics | 87.5% White 5.3% Black 2.8% Hispanic |
| Population (2011) • Citizens of voting age | 61,878 48,869 |
District profile
The 166th Pennsylvania House of Representatives District is located in Delaware County and Montgomery County and includes the following areas:[1]
- Delaware County
- Haverford Township (PART, Wards 02, 03, 04, 05, 06, 07 and 08)
- Radnor Township (PART)
- Ward 01 [PART, Division 02]
- Ward 02
- Ward 03 [PART, Division 02]
- Ward 05 [PART, Division 01]
- Ward 07
- Montgomery County
- Lower Merion Township (PART)
- Ward 04
- Ward 08
- Ward 10 [PART, Division 03]
- Lower Merion Township (PART)
Representatives
| Representative | Party | Years | District home | Note |
|---|---|---|---|---|
| Prior to 1969, seats were apportioned by county. | ||||
| George R. Johnson | Republican | 1969 – 1972 | ||
| Faith Ryan Whittlesey | Republican | 1973 – 1976 | Resigned from office[2] | |
| Stephen F. Freind | Republican | 1976 – 1992 | Elected in a special election in April 1976[3] | |
| Greg Vitali | Democrat | 1993 – present | Haverford Township | Incumbent |
Recent election results
| Party | Candidate | Votes | % | ± | |
|---|---|---|---|---|---|
| Democratic | Greg Vitali | 14,924 | 58.29 | ||
| Republican | John Williamson | 10,678 | 41.71 | ||
| Margin of victory | 4,246 | 16.58 | |||
| Turnout | 25,602 | 100 | |||
| Party | Candidate | Votes | % | ± | |
|---|---|---|---|---|---|
| Democratic | Greg Vitali | 21,611 | 63.1 | ||
| Republican | Bill toal | 12,637 | 36.9 | ||
| Margin of victory | 8,974 | 26.2 | |||
| Turnout | 34,248 | 100 | |||
| Party | Candidate | Votes | % | ± | |
|---|---|---|---|---|---|
| Democratic | Greg Vitali | 14,325 | 63.1 | ||
| Republican | Sarah Armstrong | 8,375 | 36.9 | ||
| Margin of victory | 5,950 | 26.2 | |||
| Turnout | 22,700 | 100 | |||
| Party | Candidate | Votes | % | ± | |
|---|---|---|---|---|---|
| Democratic | Greg Vitali | 23,783 | 66.03 | ||
| Republican | James Knapp | 12,236 | 33.97 | ||
| Margin of victory | 11,547 | 32.06 | |||
| Turnout | 36,019 | 100 | |||
References
- Cox, Harold (2004). "Legislatures - 1776-2004". Wilkes University Election Statistics Project. Wilkes University.
- "Composite Listing of House of Representatives Districts" (PDF). Pennsylvania Department of State. Retrieved 2015-02-19.
- Cox, Harold (November 3, 2004). "Pennsylvania House of Representatives - 1975-1976" (PDF). Wilkes University Election Statistics Project. Wilkes University.
- Cox, Harold (November 3, 2004). "Pennsylvania House of Representatives - 1975-1976" (PDF). Wilkes University Election Statistics Project. Wilkes University.
External Links
- District map from the United States Census Bureau
- Pennsylvania House Legislative District Maps from the Pennsylvania Redistricting Commission.
- Population Data for District 44 from the Pennsylvania Redistricting Commission.
| Topics |
|  |
|---|---|---|
| Elections | ||
| Districts |
| |
This article is issued from Wikipedia. The text is licensed under Creative Commons - Attribution - Sharealike. Additional terms may apply for the media files.