Mathon, Switzerland
Mathon (Romansh: Maton) is a municipality in the Viamala Region in the Swiss canton of Graubünden.
Mathon | |
|---|---|
 | |
 Coat of arms | |
Location of Mathon 
| |
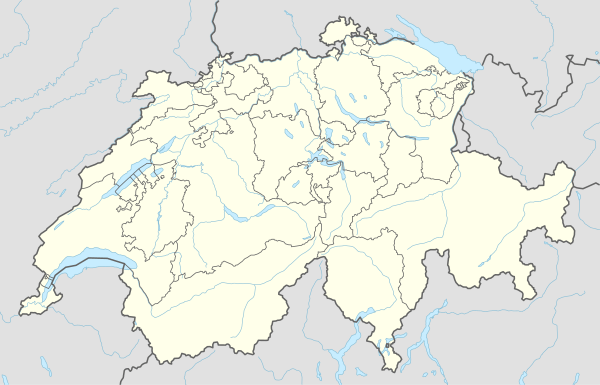 Mathon Mathon | |
| Coordinates: 46°38.17′N 9°24.85′E | |
| Country | Switzerland |
| Canton | Graubünden |
| District | Viamala |
| Area | |
| • Total | 15.13 km2 (5.84 sq mi) |
| Elevation | 865 m (2,838 ft) |
| Population (2018-12-31)[2] | |
| • Total | 51 |
| • Density | 3.4/km2 (8.7/sq mi) |
| Postal code | 7433 |
| SFOS number | 3708 |
| Surrounded by | Casti-Wergenstein, Donat, Lohn, Safien, Tschappina |
| Website | www SFSO statistics |
History
Mathon is first mentioned about 840 as in Mentaune.[3]
Geography
Mathon has an area, as of 2006, of 15.1 km2 (5.8 sq mi). Of this area, 66.3% is used for agricultural purposes, while 10% is forested. Of the rest of the land, 1.4% is settled (buildings or roads) and the remainder (22.3%) is non-productive (rivers, glaciers or mountains).[4]
Before 2017, the municipality was located in the Schams sub-district, of the Hinterrhein district, after 2017 it was part of the Viamala Region.[5] The village is a haufendorf (an irregular, unplanned and quite closely packed village, built around a central square) at an elevation of 1,521 m (4,990 ft) in the center of the upper Schamserberg region.
Demographics
Mathon has a population (as of 31 December 2018) of 51[6] nationals. Over the last 10 years the population has decreased at a rate of 14.1%.[4]
As of 2000, the gender distribution of the population was 56.4% male and 43.6% female.[7] The age distribution, as of 2000, in Mathon is; 12 people or 23.1% of the population are between 0 and 9 years old. 6 people or 11.5% are 10 to 14, and 1 person or 1.9% is 15 to 19. Of the adult population, 3 people or 5.8% of the population are between 20 and 29 years old. 8 people or 15.4% are 30 to 39, 6 people or 11.5% are 40 to 49, and 2 people or 3.8% are 50 to 59. The senior population distribution is 6 people or 11.5% of the population are between 60 and 69 years old, 6 people or 11.5% are 70 to 79, there is 1 person or 1.9% who is 80 to 89, and 1 person who is 90 to 99.[8]
In the 2007 federal election the most popular party was the SVP which received 66.9% of the vote. The next three most popular parties were the SPS (19.2%), the FDP (12.3%) and the CVP (1.5%).[4]
The entire Swiss population is generally well educated. In Mathon about 78.3% of the population (between age 25-64) have completed either non-mandatory upper secondary education or additional higher education (either university or a Fachhochschule).[4]
Mathon has an unemployment rate of 0.83%. As of 2005, there were 17 people employed in the primary economic sector and about 8 businesses involved in this sector. people are employed in the secondary sector and there are businesses in this sector. 8 people are employed in the tertiary sector, with 3 businesses in this sector.[4]
The historical population is given in the following table:[3]
| year | population |
|---|---|
| 1780 | 123 |
| 1850 | 111 |
| 1900 | 74 |
| 1950 | 65 |
| 2000 | 52 |
Languages
Most of the population (as of 2000) speaks Romansh (53.8%), with the rest speaking German (46.2%).[4] The municipality is about evenly divided between German-speaking and Romansh-speaking population. Although 87% of the population understands Romansch, German is now the sole official language.
References
- "Arealstatistik Standard - Gemeinden nach 4 Hauptbereichen". Federal Statistical Office. Retrieved 13 January 2019.
- "Ständige Wohnbevölkerung nach Staatsangehörigkeitskategorie Geschlecht und Gemeinde; Provisorische Jahresergebnisse; 2018". Federal Statistical Office. 9 April 2019. Retrieved 11 April 2019.
- Mathon in German, French and Italian in the online Historical Dictionary of Switzerland.
- Swiss Federal Statistical Office Archived 2016-01-05 at the Wayback Machine accessed 7 October 2009
- Swiss Federal Statistical Office - Amtliches Gemeindeverzeichnis der Schweiz - Mutationsmeldungen 2016 accessed 16 February 2017
- Swiss Federal Statistical Office - STAT-TAB, online database – Ständige und nichtständige Wohnbevölkerung nach institutionellen Gliederungen, Geburtsort und Staatsangehörigkeit (in German) accessed 23 September 2019
- Graubunden in Numbers Archived 2009-09-24 at the Wayback Machine (in German) accessed 21 September 2009
- Graubunden Population Statistics Archived 2009-08-27 at the Wayback Machine (in German) accessed 21 September 2009
| Wikimedia Commons has media related to Mathon. |