List of countries by military expenditures
This article contains a list of countries by military expenditure in a given year. Military expenditure figures are presented in United States dollars based on either constant or current exchange rates.[1]
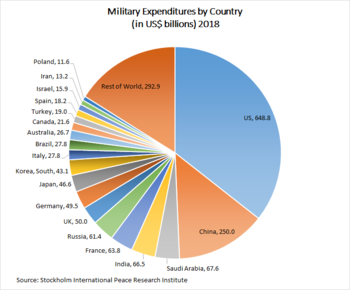
Total military spending
- Stockholm International Peace Research Institute (SIPRI) 2019 fact sheet
The first list is based on the SIPRI fact sheet which includes a list of the world's top 15 military spenders in 2019, based on current market exchange rates.[1]
The second list is based on the 2020 edition of "The Military Balance" published by the (IISS) using average market exchange rates.[2]
| List by the Stockholm International Peace Research Institute 2020 Fact Sheet (for 2019)[1] SIPRI Military Expenditure Database[3] |
List by the International Institute for Strategic Studies Top 15 Defence Budgets 2019[4] | ||||||||||||||||||||||||||||||||||||||||||||||||||||||||||||||||||||||||||||||||||||||||||||||||||||||||||||||||||||
|
|
Spending by GDP
This first list is a list of countries by military expenditure share of GDP—more specifically, a list of the top 15 countries by percentage share in recent years—the amount spent by a nation on its military as a share of its GDP.
The second list presents this as a share of the general government expenditure. The first list is sourced from the Stockholm International Peace Research Institute for the year 2017 and from Military Balance 2017 published by International Institute for Strategic Studies for the year 2016. The second list is sourced only from the Stockholm International Peace Research Institute for the year 2017.
None of the following analyze such potential record-breakers like North Korea, Syria, Yemen, and Libya.
Military expenditure as a share of GDP
| List by the Stockholm International Peace Research Institute SIPRI Military Expenditure Database[6] (2018) |
List by the International Institute for Strategic Studies The Military Balance 2017, (for 2016)[7] | |||||||||||||||||||||||||||||||||||||||||||||||||||||||||||||||||||||||||||||||||||||||||||||||||||
|
|
Military expenditure as a share of government spending (2018)
| Rank | Country | % of spending[8] |
|---|---|---|
| 1 | 31.9 | |
| 2 | 24.6 | |
| 3 | 20.9 | |
| 4 | 19.0 | |
| 5 | 18.5 | |
| 6 | 17.1 | |
| 7 | 15.8 | |
| 8 | 15.6 | |
| 9 | 15.2 | |
| 10 | 15.0 | |
| 11 | 14.6 | |
| 12 | 14.3 | |
| 13 | 13.8 | |
| 14 | 12.4 | |
| 15 | 11.6 |
Military expenditure as a share of goods exports (2018)
| Rank | Country | % of exports[9][10] |
|---|---|---|
| 1 | 158.8 | |
| 2 | 73.9 | |
| 3 | 47.5 | |
| 4 | 45.8 | |
| 5 | 38.7 | |
| 6 | 37.8 | |
| 7 | 30.1 | |
| 8 | 27.7 | |
| 9 | 26.8 | |
| 10 | 25.3 | |
| 11 | 25.2 | |
| 12 | 23.9 | |
| 13 | 23.2 | |
| 14 | 22.9 | |
| 15 | 20.0 |
*59.8% including the costs for veterans in 2016[11]
Notes
- SIPRI estimate.
- The figures for Saudi Arabia include expenditure for public order and safety and might be slightly overestimated.
- Highly uncertain data.
See also
| Wikinews has related news: |
References
- Tian, Nan; Fleurant, Aude; Kuimova, Alexandra; Wezeman, Pieter D.; Wezeman, Siemon T. (27 April 2020). "Trends in World Military Expenditure, 2019" (PDF). Stockholm International Peace Research Institute. Retrieved 27 April 2020.
- International Institute for Strategic Studies (14 February 2020). The Military Balance 2020. London: Routledge. ISBN 978-0367466398.
- "Data for all countries from 1988–2018 in constant (2017) USD (pdf)" (PDF). SIPRI. Retrieved 30 April 2019.
- "IISS Military Balance 2020".
- 2017 data from: "Military expenditure (% of GDP). Stockholm International Peace Research Institute ( SIPRI ), Yearbook: Armaments, Disarmament and International Security". World Bank. Retrieved 2019-03-08.
- "SIPRI Military Expenditure Database | SIPRI". www.sipri.org. Retrieved 2018-05-09.
- The Military Balance 2017. Routledge, Chapman & Hall, Incorporated, 2017. 2017. p. 19. ISBN 9781857439007.
- "Military expenditure (% of general government expenditure) | Data". data.worldbank.org. Retrieved 2019-10-12.
- "Military expenditure (current USD) | Data". data.worldbank.org. Retrieved 2019-10-12.
- "Goods exports (BoP, current US$) | Data". data.worldbank.org. Retrieved 2019-10-12.
- "Countries by military expenditures as a percentage of exports" (PDF).
External links
- SIPRI military expenditure database (sipri.org)