List of busiest railway stations in North America
This is a list of the busiest railway stations in North America. The figures are collected by the different operating agencies of each railway station, and are estimates based on ticket usage data, crowd sizes and other extrapolations. This data only covers Canada and the United States as a detailed passenger volume breakdown of other countries in North America such as Mexico is not available.
List of busiest railway stations by annual passenger and commuter rail volume
This list ranks railway stations in North America based on annual volume of passengers traveling by passenger rail or commuter rail only. Other visitors are not included.
For example, Grand Central Terminal, a major attraction on its own right in New York City, has nearly 500,000[1][2][Note 1] people visiting the station daily either to shop, dine, conduct business, meet family and friends, or admire the station. Those visitors are not included in the count of passengers as they are not using the passenger rail or the commuter rail services. Similarly, Grand Central Terminal also has a major subway station in its vicinity which processes nearly 45 million[3] passengers annually but since they arrive and depart using the subway, they are also not included in the final passenger count.
Only stations which process at least 10 million annual passengers are shown. The below list is comparable with how the United Kingdom tracks its busiest railway stations as they also use the same criteria.

.jpg)


.jpg)
List of busiest railway stations by average weekday visitors
This list ranks railway stations in North America by average weekday visitors. There are two categories of visitors. The first are transit visitors which includes rail passengers, rail commuters, subway riders from adjoining subway stations, and people using other forms of transportation to get to and from the station such as Buses, Light Rail, Air Trains, etc. The second are non-transit visitors which includes people using the station amenities to shop, dine, meet family and friends, tourists visiting the station, people meeting at the station to conduct business, people walking through the station, and station employees and other workers who pass through the station. The average weekday visitor is the total of both categories.
Only stations which handle an average of at least 100,000 weekday visitors are shown.
| Rank | Station | Transit Visitors (Avg. per/weekday) |
Non-Transit Visitors (Avg. per/weekday) |
Total Visitors (Avg. per/weekday) |
City | Country |
|---|---|---|---|---|---|---|
| 1 | Grand Central Terminal | 250,000[35] | 500,000 | 750,000[36] | New York City | |
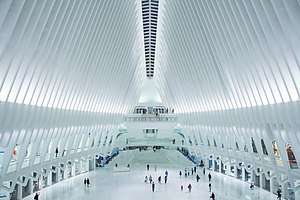
| 2 | New York Penn Station | 630,000[37] | 20,000 | 650,000[38] | New York City | |
| 3 | Toronto Union Station | 250,000[39] | 50,000 | 300,000[40] | Toronto | |
| 4 | Jamaica Station | 200,000 | - | 200,000[41] | New York City | |
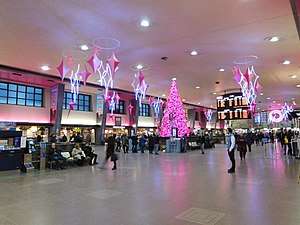
| 5 | Washington Union Station | 50,000[Note 3] | 110,000[42][Note 4] | 160,000 | Washington, D.C. | |
| 6 | Chicago Union Station | 150,000 | - | 150,000[43] | Chicago | |
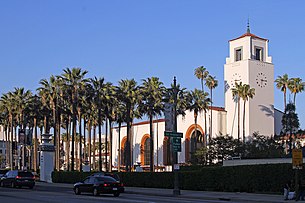
| 7 | Los Angeles Union Station | 110,000 | - | 110,000[44] | Los Angeles | |
| 8 | Ogilvie Transportation Center | 106,700 | - | 106,700[45] | Chicago |
Notes
- 750,000 people visit Grand Central Terminal and over 250,000 are commuters who commute using passenger rail, commuter rail, subways and buses. Which gives 500,000 non-transit visitors.
- Total is derived by adding up passengers on LIRR, NJ Transit and Amtrak. LIRR 2017 Totals breaks down as follows: 117180 daily weekday arrivals, 116160 daily weekday departures, 48960 Saturday arrivals, 48470 Saturday departures, 36950 Sunday arrivals, 40700 Sunday departures. This gives us a yearly total of ((117180+116160)*5+(48960+48470)+(36950+40700))*52 = 69,722,560. NJ Transit 2017 Totals breaks down as follows: 93,305 weekday arrivals and departures from Penn Station. Breakdown for Saturday and Sunday is not given but it can be calculated by looking at the percentage drop in total ridership. 307853 total trips took place on NJ Transit on a weekday, 104088 took place on Saturday and 87709 on Sunday. Which means ridership on Saturday is 33.8% that of an average weekday and ridership on Sunday is 28.5% that of a weekday. Which gives (93305*0.338) = 31547 arrivals and departures from Penn Station on Saturday and (93305*0.285) = 26853 arrivals and departures from Penn Station Sunday. Giving us a yearly total of ((93305*5)+31547+26853)*52 = 27,296,100. Amtrak 2017 total is: 10,397,729. Totaling up these 3 figures gives us: 69,722,560+27,296,100+10,397,729 = 107,416,389
- Washington Union Station has 5,225,460 annual amtrak passengers and 28,864 daily metro riders. 5,225,460/365 + 28,864 = 43,180 and rounded up to 50,000 due to higher average of weekday vs weekend.
- Washington Union Station receives 40 million annual visitors. 40,000,000/365 = 109,589. Rounded it to 110,000.
See also
References
- https://www.grandcentralterminal.com/about/
- https://www.grandcentralterminal.com/
- "Facts and Figures: Annual Subway Ridership 2014–2019". Metropolitan Transportation Authority. 2020. Retrieved May 26, 2020.
- "NJ TRANSIT FACTS AT A GLANCE" (PDF). New Jersey Transit. Retrieved October 2, 2016.
- "How Many Riders Use NJ Transit's Hoboken Train Station?". Hoboken Patch. Retrieved 2018-07-18.
- "Amtrak Fact Sheet, FY2017, State of New York" (PDF). Amtrak. November 2017. Retrieved January 23, 2008.
- http://web.mta.info/mta/news/books/docs/2017%20LIRR%20Ridership%20Book.pdf
- "About Union Station". City of Toronto. Archived from the original on August 11, 2015. Retrieved August 14, 2015.
- "Info to GO" (PDF). GO Transit. April 2015. Archived from the original (PDF) on May 8, 2016. Retrieved April 26, 2016.
- "2017 MNR Ridership Appendix" (PDF). Metropolitan Transportation Authority. April 23, 2018. p. 9. Retrieved November 24, 2018.
- "State-of-the-Art Computerized Centralized Signal and Switch Control System installed at busy Jamaica Station Complex". mta.info. MTA. November 7, 2011. Retrieved June 16, 2015.
- "Chicago Union Station Master Plan Study Completed" (Press release). City of Chicago. May 23, 2012. Retrieved February 11, 2013.
- https://metrarail.com/content/dam/metra/documents/ridership_reports/Passgr%20Ops%20v4%2020131014.pdf
- "Boston's South Station: The ultimate guide". Curbed Boston. Vox Media. Retrieved January 23, 2020.
- "QUARTERLY RIDERSHIP TRENDS ANALYSIS" (PDF). New Jersey Transit. Archived from the original (PDF) on December 27, 2012. Retrieved January 4, 2013.
- "How Many Riders Use NJ Transit's Hoboken Train Station?". Hoboken Patch. Retrieved 2018-07-18.
- "Amtrak Fact Sheet, FY2017, State of New Jersey" (PDF). Amtrak. November 2017. Retrieved 26 December 2017.
- "PATH Ridership Report" (PDF). pathnynj.gov. Port Authority of New York and New Jersey. 2017. Retrieved January 28, 2018.
- "PATH Ridership Report" (PDF). pathnynj.gov. Port Authority of New York and New Jersey. 2017. Retrieved January 28, 2018.
- "QUARTERLY RIDERSHIP TRENDS ANALYSIS" (PDF). NJ Transit. Archived from the original (PDF) on December 27, 2012. Retrieved January 4, 2013.
- "How Many Riders Use NJ Transit's Hoboken Train Station?". Hoboken Patch. Retrieved 2018-07-18.
- "PATH Ridership Report" (PDF). pathnynj.gov. Port Authority of New York and New Jersey. 2017. Retrieved January 28, 2018.
- "Metrorail Average Weekday Passenger Boardings" (PDF). WMATA. Retrieved 7 February 2017.
- "Amtrak Fact Sheet, FY2017, District of Columbia" (PDF). Amtrak. November 2017. Retrieved 29 December 2017.
- "QUARTERLY RIDERSHIP TRENDS ANALYSIS" (PDF). New Jersey Transit. Archived from the original (PDF) on December 27, 2012. Retrieved January 2, 2013.
- "Amtrak State Fact Sheet, FY2017, Commonwealth of Pennsylvania" (PDF). Amtrak. November 2017. Retrieved December 5, 2017.
- "Fiscal Year 2018 Annual Service Plan" (PDF). setpa.org.
- "Amtrak Fact Sheet, FY2017, State of California" (PDF). Amtrak. November 2017. Retrieved 22 December 2017.
- "Metro Board approves Union Station Master Plan, allowing near-term projects to go forward | Metro's The Source". Thesource.metro.net. 2014-10-23. Retrieved 2015-12-23.
- "Facts and Numbers". Southern California Regional Rail Authority. Retrieved November 14, 2017.
- On the Bi-Level, October 2007.
- "Base de données 2011 - Attraits/Attractions". Tourisme Montréal. Archived from the original on 31 December 2013. Retrieved 24 May 2013.
- "Montreal, QC (MTR)". GreatAmericanStations.com. 2016. Archived from the original on 28 May 2012. Retrieved 19 February 2017.
- AMT Rapport Annuel 2015 - Transformer la mobilité (PDF), Agence métropolitaine de transport (AMT), p. 10, ISBN 978-2-550-75552-4, archived (PDF) from the original on 16 October 2016, retrieved 26 September 2016
- https://www.grandcentralterminal.com/
- https://www.grandcentralterminal.com/about/
- Devin Leonard (January 10, 2018). "The Most Awful Transit Center in America Could Get Unimaginably Worse". Bloomberg L.P. Retrieved November 14, 2018.
- https://untappedcities.com/2016/11/03/10-fun-facts-about-the-current-penn-station-we-learned-at-futurepenn-summit/
- https://web.archive.org/web/20150811073230/https://www1.toronto.ca/wps/portal/contentonly?vgnextoid=5e05962c8c3f0410VgnVCM10000071d60f89RCRD
- https://torontounion.ca/
- "State-of-the-Art Computerized Centralized Signal and Switch Control System installed at busy Jamaica Station Complex". mta.info. MTA. November 7, 2011. Retrieved June 16, 2015.
- https://www.travelandleisure.com/slideshows/worlds-most-visited-tourist-attractions#5
- "Chicago Union Station Master Plan Study Completed" (Press release). City of Chicago. May 23, 2012. Retrieved February 11, 2013.
- "Metro Board approves Union Station Master Plan, allowing near-term projects to go forward | Metro's The Source". Thesource.metro.net. 2014-10-23. Retrieved 2015-12-23.
- https://metrarail.com/content/dam/metra/documents/ridership_reports/Passgr%20Ops%20v4%2020131014.pdf