List of European Union member states by average wage
This is a map and list of European Union member states containing monthly (annual divided by 12 months) net income (after taxes) according to average and median wages of full-time workers. The chart below reflects the average (mean) and median wage as reported by Eurostat and the EU-SILC Survey for 2018.[1] In less developed markets, actual incomes may exceed those listed in the table due to the existence of grey economies. In some countries, social security, contributions for pensions, public schools, and health are included in taxes.
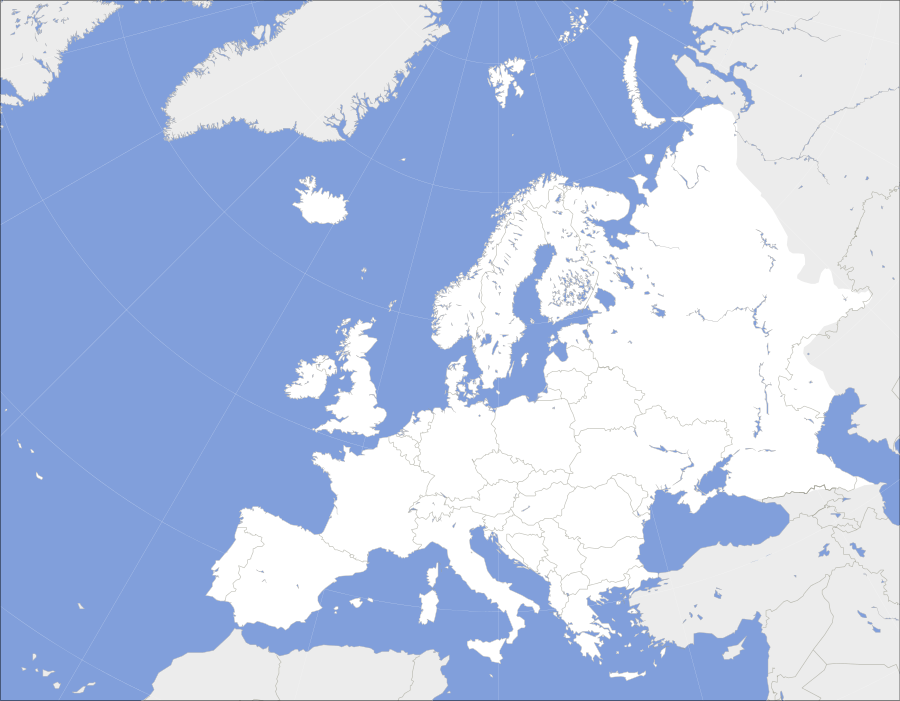
Map
The countries and territories in purple on the map have net average monthly salaries in excess of €3,000, in blue – in the range of €1,500–€2,999, in green – €600 to €1,499, in yellow – €400 to €599, in red - below €400.
Cadiz
Atlantic
Ocean
Wages by EU member states
| EU member state | Average Net Wage | Median Net Income | date | Annual Median Income € |
|---|---|---|---|---|
| €2,639 | €2,098 | 2018 | 25,176 | |
| €2430 | €1,974 | 2018 | 23,686 | |
| €459 | €299 | 2018 | 3,590 | |
| €756 | €555 | 2018 | 6,659 | |
| €1,742 | €1,278 | 2018 | 15,336 | |
| €939 | €757 | 2018 | 9,088 | |
| €3,033 | €2,509 | 2018 | 30,104 | |
| €1,141 | €877 | 2018 | 10,524 | |
| €2,567 | €2,045 | 2018 | 24,544 | |
| €2,342 | €1,852 | 2018 | 22,220 | |
| €2,540 | €1,893 | 2018 | 22,713 | |
| €1,306 | €655 | 2018 | 7,863 | |
| €719 | €452 | 2018 | 5,424 | |
| €2,908 | €2,077 | 2018 | 24,920 | |
| €1,788 | €1,403 | 2018 | 16,844 | |
| €709 | €611 | 2018 | 7,333 | |
| €722 | €575 | 2018 | 6,895 | |
| €3,495 | €3,356 | 2018 | 40,270 | |
| €1,545 | €1,232 | 2018 | 14,781 | |
| €2,989 | €2,001 | 2018 | 24,016 | |
| €793 | €548 | 2018 | 6,574 | |
| €1,122 | €779 | 2018 | 9,346 | |
| €667 | €274 | 2019 | 3,284 | |
| €770 | €622 | 2018 | 7,462 | |
| €1,080 | €1,104 | 2018 | 13,244 | |
| €1,784[2] | €1,232 | 2018 | 14,785 | |
| €2,757 | €2,128 | 2018 | 25,540 | |
| €1441 | €1,473 | 2018 | 17,673 | |
See also
Plotted maps
- List of European countries by average wage
- List of European countries by unemployment rate
- Economy of the European Union
- List of American countries by average wage
- List of countries by GDP (nominal) per capita
- List of countries by GDP (PPP) per capita
- European countries by electricity consumption per person
- European countries by employment in agriculture (% of employed)
- European countries by fossil fuel use (% of total energy)
- List of European Union member states by health expense per person
- European countries by military expenditure as a percentage of government expenditure
- European countries by percent of population aged 0-14
- European countries by percentage of urban population
- European countries by percentage of women in national parliaments
- List of sovereign states in Europe by life expectancy
- List of countries by number of Internet users
References
External links
- net earnings 2018 Eurostat: Wages and labour costs
- Eurostat: Minimum wages August 2011
- FedEE;Pay in Europe 2010
- Wages (statutory minimum, average monthly gross, net) and labour cost (2005) CE Europe
- Wages and Taxes for the Average Joe in the EU 27 2009
- ru: Moldovans have lowest wages in Europe
- UK Net Salary Calculator
- Database Central Europe: wages in Central and Eastern Europe