Hinabangan
Hinabangan, officially the Municipality of Hinabangan (Waray: Bungto han Hinabangan; Tagalog: Bayan ng Hinabangan), is a 4th class municipality in the province of Samar, Philippines. According to the 2015 census, it has a population of 13,673 people.[3]
Hinabangan | |
|---|---|
| Municipality of Hinabangan | |
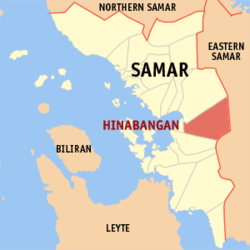 Map of Samar with Hinabangan highlighted | |
OpenStreetMap 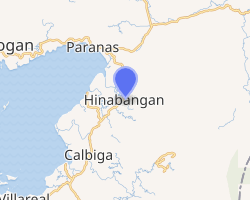
| |
.svg.png) Hinabangan Location within the Philippines | |
| Coordinates: 11°42′N 125°04′E | |
| Country | |
| Region | Eastern Visayas (Region VIII) |
| Province | Samar |
| District | 2nd district of Samar |
| Founded | 1948 |
| Barangays | 21 (see Barangays) |
| Government | |
| • Type | Sangguniang Bayan |
| • Mayor | Elena M. Dieza |
| • Vice Mayor | Clarito P. Rosal |
| • Congressman | Sharee Ann T. Tan |
| • Municipal Council | Councilors
|
| • Electorate | 11,171 voters (2019) |
| Area | |
| • Total | 460.08 km2 (177.64 sq mi) |
| Population (2015 census)[3] | |
| • Total | 13,673 |
| • Density | 30/km2 (77/sq mi) |
| • Households | 2,781 |
| Economy | |
| • Income class | 4th municipal income class |
| • Poverty incidence | 39.39% (2015)[4] |
| • Revenue (₱) | 98,303,392.82 (2016) |
| Time zone | UTC+8 (PST) |
| ZIP code | 6713 |
| PSGC | |
| IDD : area code | +63 (0)55 |
| Climate type | tropical rainforest climate |
| Native languages | Waray Tagalog |
Hinabangan was formed in 1948 from the former municipal districts of Concord and Hinabangan.[5]
Barangays
Hinabangan is politically subdivided into 21 barangays.
- Bagacay
- Binobucalan
- Bucalan
- Cabalagnan
- Canano
- Cansolabao
- Concord
- Dalosdoson
- Intik
- Lim-ao
- Osmeña
- Poblacion 1 (Barangay 1)
- Poblacion 2 (Barangay 2)
- Rawis
- San Rafael
- Tabay
- Yabon
- Cabang
- Malihao
- San Jose
- Fatima
- Mugdo
Climate
| Climate data for Hinabangan, Samar | |||||||||||||
|---|---|---|---|---|---|---|---|---|---|---|---|---|---|
| Month | Jan | Feb | Mar | Apr | May | Jun | Jul | Aug | Sep | Oct | Nov | Dec | Year |
| Average high °C (°F) | 27 (81) |
28 (82) |
28 (82) |
30 (86) |
30 (86) |
30 (86) |
29 (84) |
29 (84) |
29 (84) |
29 (84) |
28 (82) |
28 (82) |
29 (84) |
| Average low °C (°F) | 22 (72) |
22 (72) |
22 (72) |
23 (73) |
24 (75) |
24 (75) |
24 (75) |
24 (75) |
24 (75) |
24 (75) |
23 (73) |
23 (73) |
23 (74) |
| Average precipitation mm (inches) | 114 (4.5) |
81 (3.2) |
94 (3.7) |
81 (3.2) |
119 (4.7) |
192 (7.6) |
186 (7.3) |
158 (6.2) |
167 (6.6) |
185 (7.3) |
202 (8.0) |
176 (6.9) |
1,755 (69.2) |
| Average rainy days | 18.6 | 14.7 | 16.8 | 17.8 | 22.3 | 25.9 | 27.5 | 26.2 | 26.6 | 27.0 | 24.6 | 22.3 | 270.3 |
| Source: Meteoblue [6] | |||||||||||||
Demographics
| Year | Pop. | ±% p.a. |
|---|---|---|
| 1918 | 1,562 | — |
| 1939 | 2,011 | +1.21% |
| 1948 | 7,718 | +16.12% |
| 1960 | 7,004 | −0.81% |
| 1970 | 10,970 | +4.58% |
| 1975 | 12,022 | +1.85% |
| 1980 | 10,786 | −2.15% |
| 1990 | 11,906 | +0.99% |
| 1995 | 12,151 | +0.38% |
| 2000 | 12,120 | −0.05% |
| 2007 | 12,129 | +0.01% |
| 2010 | 12,651 | +1.55% |
| 2015 | 13,673 | +1.49% |
| Source: Philippine Statistics Authority[3][7][8][9] | ||
Education
Hinabangan has 19 public primary and elementary schools:
- Bagacay Elementary School
- Binubucalan Elementary School
- Bucalan Primary School
- Cabalagnan Elementary School
- Cabang Elementary School
- Canano Elementary School
- Cansolabao Elementary School
- Concord Elementary School
- Dalosdoson Elementary School
- Fatima Elementary School
- Hinabangan Central School
- Lim-Ao Elementary School
- Malihao Primary School
- Mugdo Elementary School
- Osmena Elementary School
- Rawis Elementary School
- San Rafael Elementary School
- Tabay Elementary School
- Yabon Elementary School
Hinabangan also has two public high schools:
- Bagacay National High School
- Hinabangan National High School
References
- "Municipality". Quezon City, Philippines: Department of the Interior and Local Government. Retrieved 31 May 2013.
- "Province: Samar (Western Samar)". PSGC Interactive. Quezon City, Philippines: Philippine Statistics Authority. Retrieved 12 November 2016.
- Census of Population (2015). "Region VIII (Eastern Visayas)". Total Population by Province, City, Municipality and Barangay. PSA. Retrieved 20 June 2016.
- "PSA releases the 2015 Municipal and City Level Poverty Estimates". Quezon City, Philippines. Retrieved 12 October 2019.
- "An act converting the municipal districts of Concord and Hinabangan, province of Samar, into a regular municipality". LawPH.com. Retrieved 2011-04-08.
- "Hinabangan: Average Temperatures and Rainfall". Meteoblue. Retrieved 29 February 2020.
- Census of Population and Housing (2010). "Region VIII (Eastern Visayas)". Total Population by Province, City, Municipality and Barangay. NSO. Retrieved 29 June 2016.
- Censuses of Population (1903–2007). "Region VIII (Eastern Visayas)". Table 1. Population Enumerated in Various Censuses by Province/Highly Urbanized City: 1903 to 2007. NSO.
- "Province of Samar (Western Samar)". Municipality Population Data. Local Water Utilities Administration Research Division. Retrieved 17 December 2016.
External links
- Hinabangan Profile at PhilAtlas.com
- Philippine Standard Geographic Code
- Philippine Census Information
- Local Governance Performance Management System
Places adjacent to Hinabangan | ||||||||||
|---|---|---|---|---|---|---|---|---|---|---|
| ||||||||||
This article is issued from Wikipedia. The text is licensed under Creative Commons - Attribution - Sharealike. Additional terms may apply for the media files.