Heron, Montana
Heron is a census-designated place (CDP) in Sanders County, Montana, named for the village of Heron which is located within it. The population of the entire CDP was 149 at the 2000 census.
Heron, Montana | |
|---|---|
 Location of Heron, Montana | |
| Coordinates: 48°3′27″N 115°57′37″W | |
| Country | United States |
| State | Montana |
| County | Sanders |
| Area | |
| • Total | 3.4 sq mi (8.8 km2) |
| • Land | 3.4 sq mi (8.8 km2) |
| • Water | 0.0 sq mi (0.0 km2) |
| Elevation | 2,251 ft (686 m) |
| Population (2000) | |
| • Total | 149 |
| • Density | 43.9/sq mi (17.0/km2) |
| Time zone | UTC-7 (Mountain (MST)) |
| • Summer (DST) | UTC-6 (MDT) |
| ZIP code | 59844 |
| Area code(s) | 406 |
| FIPS code | 30-35875 |
| GNIS feature ID | 0784801 |
Geography
Heron is located at 48°3′27″N 115°57′37″W (48.057437, -115.960373).[1]
According to the United States Census Bureau, the CDP has a total area of 3.4 square miles (8.8 km2), all land.
Climate
Heron has a continental, quasi-Mediterranean climate (Dsb) that has more in common with northern Idaho and the Pacific Northwest than the rest of Montana. It has one of the wettest climates in the state (outside isolated mountain areas), averaging nearly 34 inches of precipitation per year. Winters are wet and often snowy with occasional rain; summers are mostly dry with sunny, warm days and cool to chilly nights.
Another very striking feature of Heron's climate is the patterned, extremely large seasonal variation in diurnal temperature range: only 10-11 degrees in the wettest months, November through January, expanding to nearly 35 degrees in the driest months, July and August, reflecting prevalent low humidity during those months. Around 11 days per year reach 90 F., while 100 F. is a very rare occurrence. Nights are cool year round with freezes having been recorded in every month. On average, the lowest temperature each year is -12 F., placing Heron in hardiness zone 5B.
Average monthly precipitation is very high by Montana standards, especially in the wettest months of November through January, but Heron experiences continuing moderately wet conditions each month from February to June. In May and June, Heron shares with the rest of Montana some frequency of shower and thunderstorm activity, making these the wettest months in virtually all other areas of Montana, but not in Heron due to its exceptionally wet winters.
Overall, Heron's average annual precipitation cycle is similar to that of the Pacific Northwest in its dry summer and wet winter (with a November maximum, as in Seattle, WA), but somewhat transitional into the typical Montana and Wyoming pattern of a May or June maximum, reflected in Heron's continued relatively high rainfall those months. The combination of these factors with possible orographic lift results in Heron being one of the wettest locations in Montana, mostly a dry state elsewhere.
| Climate data for Heron 1981-2010, extremes 1912- | |||||||||||||
|---|---|---|---|---|---|---|---|---|---|---|---|---|---|
| Month | Jan | Feb | Mar | Apr | May | Jun | Jul | Aug | Sep | Oct | Nov | Dec | Year |
| Record high °F (°C) | 61 (16) |
59 (15) |
73 (23) |
88 (31) |
96 (36) |
100 (38) |
105 (41) |
106 (41) |
97 (36) |
87 (31) |
68 (20) |
58 (14) |
106 (41) |
| Average high °F (°C) | 33.0 (0.6) |
37.9 (3.3) |
46.8 (8.2) |
57.4 (14.1) |
66.3 (19.1) |
73.0 (22.8) |
81.3 (27.4) |
80.9 (27.2) |
70.2 (21.2) |
54.6 (12.6) |
39.7 (4.3) |
31.7 (−0.2) |
56.1 (13.4) |
| Average low °F (°C) | 22.3 (−5.4) |
22.8 (−5.1) |
27.2 (−2.7) |
32.0 (0.0) |
38.4 (3.6) |
44.5 (6.9) |
47.1 (8.4) |
45.8 (7.7) |
39.7 (4.3) |
33.3 (0.7) |
28.6 (−1.9) |
21.7 (−5.7) |
33.6 (0.9) |
| Record low °F (°C) | −39 (−39) |
−32 (−36) |
−22 (−30) |
−1 (−18) |
19 (−7) |
25 (−4) |
29 (−2) |
21 (−6) |
9 (−13) |
4 (−16) |
−14 (−26) |
−35 (−37) |
−39 (−39) |
| Average precipitation inches (mm) | 4.25 (108) |
2.91 (74) |
2.94 (75) |
2.36 (60) |
2.83 (72) |
2.82 (72) |
1.38 (35) |
1.07 (27) |
1.73 (44) |
2.69 (68) |
4.61 (117) |
4.15 (105) |
33.74 (857) |
| Average snowfall inches (cm) | 24.5 (62) |
12.6 (32) |
8.6 (22) |
1.3 (3.3) |
0.1 (0.25) |
0 (0) |
0 (0) |
0 (0) |
0 (0) |
0.3 (0.76) |
8.8 (22) |
24.6 (62) |
80.8 (204.31) |
| Average precipitation days (≥ 0.04 in) | 14.7 | 10.8 | 12.0 | 10.1 | 10.8 | 9.8 | 5.5 | 4.6 | 6.3 | 10.2 | 14.6 | 14.2 | 123.6 |
| Average snowy days (≥ 0.4 in) | 9.6 | 5.8 | 4.0 | 1.0 | 0.1 | 0 | 0 | 0 | 0 | 0.3 | 4.7 | 10.5 | 36 |
| Source: NWS NOWDATA for Heron 2NW from the NWS Missoula area | |||||||||||||
Demographics
As of the census[2] of 2000, there were 149 people, 58 households, and 41 families residing in the CDP. The population density was 43.9 people per square mile (17.0/km2). There were 63 housing units at an average density of 18.6 per square mile (7.2/km2). The racial makeup of the CDP was 94.63% White, 3.36% Native American, 0.67% Asian, and 1.34% from two or more races.
There were 58 households, out of which 32.8% had children under the age of 18 living with them, 67.2% were married couples living together, 3.4% had a female householder with no husband present, and 29.3% were non-families. 29.3% of all households were made up of individuals, and 12.1% had someone living alone who was 65 years of age or older. The average household size was 2.57 and the average family size was 3.20.
In the CDP, the population was spread out, with 30.9% under the age of 18, 2.7% from 18 to 24, 24.8% from 25 to 44, 27.5% from 45 to 64, and 14.1% who were 65 years of age or older. The median age was 42 years. For every 100 females, there were 98.7 males. For every 100 females age 18 and over, there were 98.1 males.
The median income for a household in the CDP was $28,750, and the median income for a family was $31,875. Males had a median income of $27,500 versus $20,000 for females. The per capita income for the CDP was $14,725. There were 15.8% of families and 18.2% of the population living below the poverty line, including 4.9% of under eighteens and 8.7% of those over 64.
References
- "US Gazetteer files: 2010, 2000, and 1990". United States Census Bureau. 2011-02-12. Retrieved 2011-04-23.
- "U.S. Census website". United States Census Bureau. Retrieved 2008-01-31.
Municipalities and communities of Sanders County, Montana, United States | ||
|---|---|---|
| City | 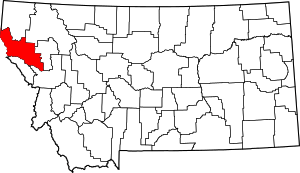 Sanders County map | |
| Towns | ||
| CDPs | ||
| Indian reservation | ||
| Footnotes | ‡This populated place also has portions in an adjacent county or counties | |