Demographics of Kiribati
This article is about the demographic features of the population of Kiribati, including population density, ethnicity, education level, health of the populace, economic status, religious affiliations and other aspects of the population.
| Demographics of Kiribati | |
|---|---|
| Population | 115,847 (2018) |
Population
| Rank | Name | Island | Pop. | ||||||
|---|---|---|---|---|---|---|---|---|---|
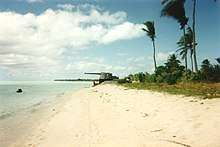 Betio 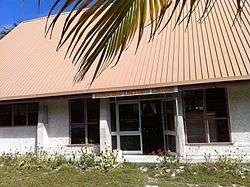 Bikenibeu |
1 | Betio | South Tarawa | 17,330 | 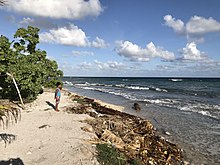 Teaoraereke 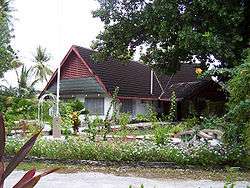 Bairiki | ||||
| 2 | Bikenibeu | South Tarawa | 7,575 | ||||||
| 3 | Teaoraereke | South Tarawa | 5,105 | ||||||
| 4 | Bairiki | South Tarawa | 3,218 | ||||||
| 5 | Temwaiku | South Tarawa | 4,072 | ||||||
| 6 | Eita | South Tarawa | 3,395 | ||||||
| 7 | Tabwakea | Kiritimati | 3,001 | ||||||
| 8 | Bonriki | South Tarawa | 2,829 | ||||||
| 9 | Ambo | South Tarawa | 2,780 | ||||||
| 10 | London | Kiritimati | 1,895 | ||||||
Statistics
| Year | Pop. | ±% |
|---|---|---|
| 1921 | 3,122 | — |
| 1931 | 29,751 | +852.9% |
| 1947 | 31,513 | +5.9% |
| 1963 | 43,336 | +37.5% |
| 1973 | 51,926 | +19.8% |
| 1978 | 56,213 | +8.3% |
| 1985 | 63,883 | +13.6% |
| 1990 | 72,335 | +13.2% |
| 1995 | 77,658 | +7.4% |
| 2000 | 84,494 | +8.8% |
| 2005 | 92,533 | +9.5% |
| 2010 | 103,058 | +11.4% |
| 2015 | 110,136 | +6.9% |
| Source: [2][3] | ||
The following demographic statistics are from the CIA World Factbook, unless otherwise indicated.[4]
Nationality
- Noun: I-Kiribati (singular and plural)
- Adjective: Kiribati or Gilbertese
Ethnic groups
- I-Kiribati 96.2%, 105,983
- Mixed/I-Kiribati 1.8% 1,974
- Tuvaluans 0.2% 198
- Others 1.8% 1,981 (2015 census)
Religions
- Roman Catholic: 57.3%
- Kiribati Uniting Church: 31.3%
- Latter-day Saints: 5.3%
- Bahá'í: 2.1%
- Seventh-day Adventist: 1.9%
- Other: 2.1% (2015 est.)
Languages
- English (official)
- Gilbertese (official)
Population
- 110,136 (2015 Census)
- 111,796 (July 2020 est.)
Age structure
- 0–14 years: 28.47% (male 16,223, female 15,604)
- 15–24 years: 20.24% (male 11,171, female 11,459)
- 25–54 years: 40.05% (male 21,530, female 23,249)
- 55–64 years: 6.65% (male 3,350, female 4,084)
- 65 years and over: 4.59% (male 2,004, female 3,122) (2015 est.)
From 2015 Census:
- 0-5 years: 17,466
- 6-14 years: 20,962
- 15-17 years: 7,089
- 18-49 years: 49,972
- + 50 years: 14,637
Median age
- Average: 23.9 years
- Male: 23.1 years
- Female: 24.8 years (2015 est.)
Population growth rate
- 1.09% (2020 est.)
Birth rate
- 20.5 births/1,000 population (2020 est.)
Death rate
- 6.9 deaths/1,000 population (2020 est.)
Net migration rate
- -2.8 migrant(s)/1,000 population (2020 est.)
Urbanization
- Urban population: 55.6% of Total population (2020)
- Rate of urbanization: 1.78% annual rate of change (2010—15 est.)
Sex ratio (male(s) to female)
- At birth: 1.05
- 0–14 years: 1.04
- 15–24 years: 0.97
- 25–54 years: 0.93
- 55–64 years: 0.82
- 65 years and over: 0.64
- Total population: 0.94 (2020 est.)
Maternal mortality rate
- 90 deaths/100,000 live births (2015 est.)
Infant mortality rate
- Total: 34.26 deaths/1,000 live births
- Male: 35.48 deaths/1,000 live births
- Female: 32.99 deaths/1,000 live births (2015 est.)
Life expectancy at birth
- Total population: 67.5 years
- Male: 65 years
- Female: 70.2 years (2020 est.)
Total fertility rate
- 2.25 children born/woman (2020 est.)
Health expenditure (% of GDP)
- 10.8% (2017)
Physicians density
- 0.2 physicians/1,000 population (2013)
Hospital bed density
- 1.9 beds/1,000 population (2015)
Obesity – adult prevalence rate
- 46% (2016)
School life expectancy
- Male: 11 years
- Female: 12 years (2015 est.)
References
- "Population and Housing Census" (PDF). National Statistics Office. Kiribati 2015 census of population and housing. Ministry of Finance. 2015. pp. 34–50.
- "Archived copy". Archived from the original on 2015-03-29. Retrieved 2014-07-17.CS1 maint: archived copy as title (link)
- "Archived copy" (PDF). Archived from the original (PDF) on September 30, 2013. Retrieved March 17, 2013.CS1 maint: archived copy as title (link)
- "Australia-Oceania :: KIRIBATI". CIA The World Factbook.
![]()
This article is issued from Wikipedia. The text is licensed under Creative Commons - Attribution - Sharealike. Additional terms may apply for the media files.
