Central Bosnia Canton
The Central Bosnia Canton (Bosnian: Srednjobosanski kanton/Средњобосански кантон, Croatian: Županija Središnja Bosna) is one of 10 cantons of the Federation of Bosnia and Herzegovina in Bosnia and Herzegovina.
Central Bosnia Canton Srednjobosanski kanton Средњобосански кантонŽupanija Središnja Bosna | |
|---|---|
 Flag
 Coat of arms
| |
 | |
| Status | Canton of the Federation of Bosnia and Herzegovina |
| Capital and largest city | Travnik |
| Official languages | Bosnian and Croatian |
| Ethnic groups (2013[1]) | 57.58% Bosniaks38.33% Croats1.19% Serbs2.90% others |
| Demonym(s) | Central Bosnian |
| Government | Parliamentary system |
• Prime Minister | Tahir Lendo (SDA) |
| Legislature | Assembly of the Central Bosnia Canton |
| Canton of the Federation of Bosnia and Herzegovina | |
• Establishment | 12 June 1996 |
| Area | |
• Total | 3,189 km2 (1,231 sq mi) |
| Population | |
• 2013 census | 254,686 |
• Density | 85.65/km2 (221.8/sq mi) |
| GDP (nominal) | 2019 estimate |
• Total | BAM 3.099.798 million |
• Per capita | BAM 6672.98 |
| Currency | BAM |
| Time zone | UTC+1 (CET) |
| UTC+2 (CEST) | |
| Date format | dd-mm-yyyy |
| Driving side | right |
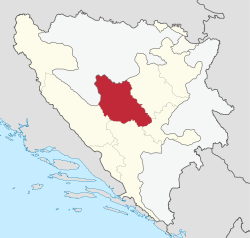
Geography
It is located in the center of the country, to the west of Sarajevo. The center of canton government is Travnik.
Municipalities
The canton is split into the municipalities of Bugojno, Busovača, Dobretići, Donji Vakuf, Fojnica, Gornji Vakuf-Uskoplje, Jajce, Kiseljak, Kreševo, Novi Travnik, Travnik, Vitez.
Demographics
Of the ten cantons comprising the Federation of Bosnia Herzegovina, Central Bosnia Canton and Herzegovina-Neretva Canton are the only ones in which neither Bosniaks nor Croats form an absolute majority. There are thus special legislative procedures for the protection of the constituent ethnic groups. Bosniaks form a majority in the municipalities of Bugojno, Donji Vakuf, Fojnica, Gornji Vakuf – Uskoplje and Travnik. Croats form a majority in the municipalities of Busovača, Dobretići, Jajce, Kreševo, Kiseljak, Novi Travnik and Vitez.
2013 Census
| Municipality | Nationality | Total | |||||
|---|---|---|---|---|---|---|---|
Bosniaks |
% |
Croats |
% |
Serbs |
% | ||
| Bugojno | 24,650 | 78.32 | 5,767 | 18.32 | 376 | 1.19 | 31,470 |
| Busovača | 8,681 | 48.47 | 8,873 | 49.54 | 205 | 1.14 | 17,910 |
| Dobretići | 0 | 0 | 1,626 | 99.81 | 1 | 0.06 | 1,629 |
| Donji Vakuf | 13,376 | 95.64 | 58 | 0.418 | 107 | 0.76 | 13,985 |
| Fojnica | 7,592 | 61.44 | 3,664 | 29.65 | 48 | 0.38 | 12,356 |
| Gornji Vakuf-Uskoplje | 12,004 | 57.34 | 8,660 | 41.37 | 30 | 0.14 | 20,933 |
| Jajce | 13,269 | 48.67 | 12,555 | 46.05 | 501 | 1.83 | 27,258 |
| Kiseljak | 7,838 | 37.82 | 11,823 | 57.05 | 409 | 1.97 | 20,722 |
| Kreševo | 1,014 | 19.23 | 4,149 | 78.68 | 26 | 0.49 | 5,273 |
| Novi Travnik | 12,067 | 50.63 | 11,002 | 46.16 | 367 | 1.53 | 23,832 |
| Travnik | 35,648 | 66.65 | 15,102 | 28.23 | 640 | 1.19 | 53,482 |
| Vitez | 10,513 | 40.69 | 14,350 | 55.54 | 333 | 1.28 | 25,836 |
| Canton | 146,662 | 57.58 | 97,629 | 38.33 | 3,043 | 1.19 | 254,686 |
Page text.[2]
| Population of Central Bosnian Canton by 1991 census * | ||||||
| Municipalities by 1991 borders | All | Bosniaks | Croats | Serbs | Yugoslavs | Others |
| Travnik | 70,747 | 31,813 | 26,118 | 7,777 | 3,743 | 1,296 |
| Novi Travnik | 30,713 | 11,625 | 12,162 | 4,097 | 2,132 | 697 |
| Vitez | 27,859 | 11,514 | 12,675 | 1,501 | 1,377 | 792 |
| Busovača | 18,879 | 8,451 | 9,093 | 623 | 510 | 202 |
| Kiseljak | 24,164 | 9,778 | 12,550 | 740 | 600 | 496 |
| Kreševo | 6,731 | 1,531 | 4,714 | 34 | 251 | 201 |
| Fojnica | 16,296 | 8,024 | 6,623 | 157 | 407 | 1,085 |
| Gornji Vakuf/Uskoplje | 25,181 | 14,063 | 10,706 | 110 | 158 | 144 |
| Bugojno | 46,889 | 19,697 | 16,031 | 8,673 | 1,561 | 927 |
| Donji Vakuf | 24,544 | 13,509 | 682 | 9,533 | 593 | 227 |
| Jajce | 45,007 | 17,380 | 15,811 | 8,663 | 2,496 | 657 |
| New municipalities and villages (1995) added to CBC | All | Bosniaks | Croats | Serbs | Yugoslavs | Others |
| Municipality Dobretići (1991 part of Skender Vakuf municipality) | 4,944 | 3 | 4,720 | 158 | 19 | 42 |
| Vlasinje (1991 part of Mrkonjić grad municipality) | 1,133 | 975 | 149 | 1 | 2 | 6 |
| Kruševo Brdo II (1991 part of Kotor Varoš municipality) | 399 | 0 | 0 | 395 | 1 | 3 |
| New municipalities and villages (1995) removed from CBC | All | Bosniaks | Croats | Serbs | Yugoslavs | Others |
| Ljuša (1991 part of Donji Vakuf municipality) | 172 | 0 | 0 | 169 | 3 | 0 |
| Municipality Jezero (1991 part of Jajce municipality) | 1,949 | 756 | 95 | 1,032 | 44 | 22 |
| Municipalities by 1991 borders | All | Bosniaks | Croats | Serbs | Yugoslavs | Others |
| Central Bosnian Canton 1991 | 341,365 | 147,608 (43%) | 131,939 (39%) | 41,261 (12%) | 13,805 (4%) | 6,753 (2%) |
- Border between two entities have also divided some settlements but the differences should be minimal. However, because of this it is not the exact data.
See also
References
- Sarajevo, juni 2016. CENZUS OF POPULATION, HOUSEHOLDS AND DWELLINGS IN BOSNIA AND HERZEGOVINA, 2013 FINAL RESULTS (PDF). BHAS. Archived from the original (PDF) on 24 December 2017. Retrieved 30 June 2016.
- Link text, additional text.
| |||||||