Castilla, Sorsogon
Castilla, officially the Municipality of Castilla, is a 3rd class municipality in the province of Sorsogon, Philippines. According to the 2015 census, it has a population of 57,827 people.[3]
Castilla | |
|---|---|
| Municipality of Castilla | |
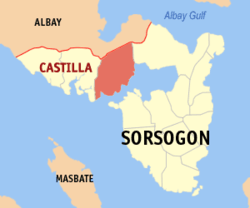 Map of Sorsogon with Castilla highlighted | |
OpenStreetMap 
| |
.svg.png) Castilla Location within the Philippines | |
| Coordinates: 12°56′55″N 123°52′56″E | |
| Country | |
| Region | Bicol Region (Region V) |
| Province | Sorsogon |
| District | 1st district |
| Named for | Castille, Spain |
| Barangays | 34 (see Barangays) |
| Government | |
| • Type | Sangguniang Bayan |
| • Mayor | Isagani B. Mendoza |
| • Vice Mayor | Vicente B. Manata |
| • Congressman | Evelina G. Escudero |
| • Electorate | 29,729 voters (2016) |
| Area | |
| • Total | 186.20 km2 (71.89 sq mi) |
| Population (2015 census)[3] | |
| • Total | 57,827 |
| • Density | 310/km2 (800/sq mi) |
| • Households | 12,266 |
| Economy | |
| • Income class | 3rd municipal income class |
| • Poverty incidence | 45.20% (2015)[4] |
| • Revenue (₱) | 128,380,307.12 (2016) |
| Time zone | UTC+8 (PST) |
| ZIP code | 4713 |
| PSGC | |
| IDD : area code | +63 (0)56 |
| Climate type | tropical rainforest climate |
| Native languages | Central Bikol Sorsoganon Tagalog |
| Website | www |
Barangays
Castilla is divided into 34 barangays.
- Amomonting
- Bagalayag
- Bagong Sirang
- Bonga
- Buenavista
- Burabod
- Caburacan
- Canjela
- Cogon
- Cumadcad
- Dangcalan
- Dinapa
- La Union
- Libtong
- Loreto
- Macalaya
- Maracabac
- Mayon
- Milagrosa
- Miluya
- Maypangi
- Monte Carmelo
- Oras
- Pandan
- Poblacion
- Quirapi
- Saclayan
- Salvacion
- San Isidro
- San Rafael
- San Roque
- San Vicente
- Sogoy
- Tomalaytay
Demographics
| Year | Pop. | ±% p.a. |
|---|---|---|
| 1903 | 3,831 | — |
| 1939 | 16,070 | +4.06% |
| 1948 | 17,578 | +1.00% |
| 1960 | 20,007 | +1.08% |
| 1970 | 27,060 | +3.06% |
| 1975 | 29,614 | +1.83% |
| 1980 | 34,782 | +3.27% |
| 1990 | 34,702 | −0.02% |
| 1995 | 40,506 | +2.94% |
| 2000 | 45,072 | +2.32% |
| 2007 | 49,407 | +1.27% |
| 2010 | 52,903 | +2.52% |
| 2015 | 57,827 | +1.71% |
| Source: Philippine Statistics Authority[3][5][6][7] | ||
Climate
| Climate data for Castilla, Sorsogon | |||||||||||||
|---|---|---|---|---|---|---|---|---|---|---|---|---|---|
| Month | Jan | Feb | Mar | Apr | May | Jun | Jul | Aug | Sep | Oct | Nov | Dec | Year |
| Average high °C (°F) | 28 (82) |
28 (82) |
29 (84) |
31 (88) |
31 (88) |
31 (88) |
29 (84) |
30 (86) |
29 (84) |
29 (84) |
29 (84) |
28 (82) |
29 (85) |
| Average low °C (°F) | 22 (72) |
21 (70) |
22 (72) |
23 (73) |
24 (75) |
25 (77) |
25 (77) |
25 (77) |
25 (77) |
24 (75) |
23 (73) |
23 (73) |
24 (74) |
| Average precipitation mm (inches) | 65 (2.6) |
44 (1.7) |
42 (1.7) |
39 (1.5) |
87 (3.4) |
150 (5.9) |
184 (7.2) |
153 (6.0) |
163 (6.4) |
154 (6.1) |
127 (5.0) |
100 (3.9) |
1,308 (51.4) |
| Average rainy days | 13.9 | 9.2 | 11.0 | 12.5 | 19.6 | 24.3 | 26.5 | 25.0 | 25.5 | 24.4 | 19.4 | 15.1 | 226.4 |
| Source: Meteoblue (Use with caution: this is modeled/calculated data, not measured locally.) [8] | |||||||||||||
Economy
Majority of the males (62.02%) falling under working age population were employed while only a little over 10% of the females were employed. Out of the municipality’s labor force, majority (52.54%) were not economically active who were either too old, sick, or still at school age. Overall, the total employment rate in Castilla was only 40.95% while unemployment was recorded at 6.50%. This is expected considering that there is inadequate employment opportunity in the municipality.
Total dependency ratio in Castilla was computed at 86.57%, which indicates more mouths to feed for those with gainful employment. Young dependency ratio was computed at 79.97% while old dependency ratio was 6.60%.
Farming and fishing are the main employment opportunities but are characteristically seasoned in nature. Castilla has 13 coastal barangays, which depend on fishing as the main economic activity.
References
- "Municipality". Quezon City, Philippines: Department of the Interior and Local Government. Retrieved 31 May 2013.
- "Province: Sorsogon". PSGC Interactive. Quezon City, Philippines: Philippine Statistics Authority. Retrieved 12 November 2016.
- Census of Population (2015). "Region V (Bicol Region)". Total Population by Province, City, Municipality and Barangay. PSA. Retrieved 20 June 2016.
- "PSA releases the 2015 Municipal and City Level Poverty Estimates". Quezon City, Philippines. Retrieved 1 January 2020.
- Census of Population and Housing (2010). "Region V (Bicol Region)". Total Population by Province, City, Municipality and Barangay. NSO. Retrieved 29 June 2016.
- Censuses of Population (1903–2007). "Region V (Bicol Region)". Table 1. Population Enumerated in Various Censuses by Province/Highly Urbanized City: 1903 to 2007. NSO.
- "Province of Sorsogon". Municipality Population Data. Local Water Utilities Administration Research Division. Retrieved 17 December 2016.
- "Castilla, Sorsogon : Average Temperatures and Rainfall". Meteoblue. Retrieved 29 December 2018.
External links
- Castilla Profile at PhilAtlas.com
- Philippine Standard Geographic Code
- Philippine Census Information
- Local Governance Performance Management System
Places adjacent to Castilla, Sorsogon | |
|---|---|