Carshalton and Wallington (UK Parliament constituency)
Carshalton and Wallington (/kɑːrˈʃɔːltən ... ˈwɒlɪŋtən/) is a constituency represented in the House of Commons of the Parliament of the United Kingdom since 2019 by Elliot Colburn, a Conservative.
| Carshalton and Wallington | |
|---|---|
| Borough constituency for the House of Commons | |
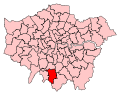 Boundary of Carshalton and Wallington in Greater London | |
| County | Greater London |
| Population | 95,322 (2011 census)[1] |
| Electorate | 69,916 (May 2015)[2] |
| Current constituency | |
| Created | 1983 |
| Member of Parliament | Elliot Colburn (Conservative) |
| Number of members | One |
| Created from | Carshalton |
The constituency was created at the 1983 general election, replacing the former seat of Carshalton.
Political history
Results since 1997 may well, given the seat's volatility in result, be more helpfully viewed as marginal majorities for the victor rather than emphatic (a majority of under 15% may be considered marginal). A national swing against the Conservatives in 1997 (-11.2%, compared to -16.2% locally) ended their three terms of widely-perceived "strong" or "safe" Conservative victories (the lowest majority seen by outgoing MP Nigel Forman was 18.9% of the vote in 1992).
Later results soon disproved assumptions of it being a safe seat for the Liberal Democrats, who had retained it since 1997. Following their role in the coalition government, there was a large swing against the party nationally, and no other seat in the southern half of England, aside from North Norfolk, was retained by a Liberal Democrat in 2015. This transformed the constituency into one the party's eight most secure seats, by virtue of those eight being the few retained by the party. The result placed Carshalton and Wallington ahead of seats the party lost that had returned a Liberal Democrat or Liberal for decades, such as Truro and St Austell, its member (or that for its direct predecessor version, Truro) having had the party's allegiance since 1974. In 2019, this seat was one of several Liberal Democrat seats gained by the Conservatives, in an election which saw two seats change hands in the opposite direction. Brake, the losing incumbent, was the Liberal Democrats' spokesman on Brexit. The party had fiercely campaigned against Britain's departure from the European Union; however, this seat voted to leave in the 2016 referendum.
Boundaries
1983–2010: The London Borough of Sutton wards of Beddington North, Beddington South, Carshalton Beeches, Carshalton Central, Carshalton North, Clockhouse, St Helier North, St Helier South, Wallington North, Wallington South, Wandle Valley, Woodcote, and Wrythe Green.
2010–present: The London Borough of Sutton wards of Beddington North, Beddington South, Carshalton Central, Carshalton South and Clockhouse, St Helier, The Wrythe, Wallington North, Wallington South, and Wandle Valley.
Members of Parliament
| Election | Member[3][4] | Party | |
|---|---|---|---|
| 1983 | Nigel Forman | Conservative | |
| 1997 | Tom Brake | Liberal Democrat | |
| 2019 | Elliot Colburn | Conservative | |
Election results
Elections in the 2010s
| Party | Candidate | Votes | % | ± | |
|---|---|---|---|---|---|
| Conservative | Elliot Colburn | 20,822 | 42.4 | ||
| Liberal Democrats | Tom Brake | 20,193 | 41.1 | ||
| Labour | Ahmad Wattoo | 6,081 | 12.4 | ||
| Brexit Party | James Woudhuysen | 1,043 | 2.1 | N/A | |
| Green | Tracey Hague | 759 | 1.5 | ||
| Christian Peoples Alliance | Ashley Dickenson | 200 | 0.4 | 0.0 | |
| Majority | 629 | 1.3 | N/A | ||
| Turnout | 49,098 | 67.3 | |||
| Registered electors | 72,926 | ||||
| Conservative gain from Liberal Democrats | Swing | ||||
| Party | Candidate | Votes | % | ± | |
|---|---|---|---|---|---|
| Liberal Democrats | Tom Brake | 20,819 | 41.0 | ||
| Conservative | Matthew Maxwell-Scott | 19,450 | 38.3 | ||
| Labour | Emine Ibrahim | 9,360 | 18.4 | ||
| Green | Shasha Khan | 501 | 1.0 | ||
| Independent | Nick Mattey | 434 | 0.9 | N/A | |
| Christian Peoples Alliance | Ashley Dickenson | 189 | 0.4 | ||
| Majority | 1,369 | 2.7 | |||
| Turnout | 50,753 | 71.6 | |||
| Registered electors | 70,849 | ||||
| Liberal Democrats hold | Swing | ||||
| Party | Candidate | Votes | % | ± | |
|---|---|---|---|---|---|
| Liberal Democrats | Tom Brake | 16,603 | 34.9 | ||
| Conservative | Matthew Maxwell-Scott | 15,093 | 31.7 | ||
| Labour | Siobhan Tate | 7,150 | 15.0 | ||
| UKIP | William Main-Ian | 7,049 | 14.8 | ||
| Green | Ross Hemingway | 1,492 | 3.2 | ||
| Christian Peoples Alliance | Ashley Dickenson | 177 | 0.4 | N/A | |
| National Front | Richard Edmonds | 49 | 0.1 | N/A | |
| Majority | 1,510 | 3.2 | |||
| Turnout | 47,613 | 68.0 | |||
| Registered electors | 69,981 | ||||
| Liberal Democrats hold | Swing | ||||
| Party | Candidate | Votes | % | ± | |
|---|---|---|---|---|---|
| Liberal Democrats | Tom Brake | 22,180 | 48.3 | ||
| Conservative | Kenneth Andrew | 16,920 | 36.8 | ||
| Labour | Shafi Khan | 4,015 | 8.7 | ||
| UKIP | Frank Day | 1,348 | 2.9 | ||
| BNP | Charlotte Lewis | 1,100 | 2.4 | N/A | |
| Green | George Dow | 355 | 0.8 | ||
| Majority | 5,260 | 11.5 | |||
| Turnout | 45,918 | 69.0 | |||
| Registered electors | 66,524 | ||||
| Liberal Democrats hold | Swing | ||||
Elections in the 2000s
| Party | Candidate | Votes | % | ± | |
|---|---|---|---|---|---|
| Liberal Democrats | Tom Brake | 17,357 | 40.3 | −4.7 | |
| Conservative | Kenneth Andrew | 16,289 | 37.8 | +4.0 | |
| Labour | Andrew Theobald | 7,396 | 17.2 | −1.2 | |
| UKIP | Francis Day | 1,111 | 2.6 | +1.4 | |
| Green | Robert Steel | 908 | 2.1 | +0.6 | |
| Majority | 1,068 | 2.5 | -8.7 | ||
| Turnout | 43,061 | 63.5 | +3.2 | ||
| Registered electors | 67,243 | ||||
| Liberal Democrats hold | Swing | −4.4 | |||
| Party | Candidate | Votes | % | ± | |
|---|---|---|---|---|---|
| Liberal Democrats | Tom Brake | 18,289 | 45.0 | +6.8 | |
| Conservative | Kenneth Andrew | 13,742 | 33.8 | +0.3 | |
| Labour | Margaret Cooper | 7,466 | 18.4 | −5.5 | |
| Green | Simon Dixon | 614 | 1.5 | +0.7 | |
| UKIP | Martin Haley | 501 | 1.2 | +0.8 | |
| Majority | 4,547 | 11.2 | +6.5 | ||
| Turnout | 40,612 | 60.3 | −13.0 | ||
| Registered electors | 67,337 | ||||
| Liberal Democrats hold | Swing | +3.3 | |||
Elections in the 1990s
| Party | Candidate | Votes | % | ± | |
|---|---|---|---|---|---|
| Liberal Democrats | Tom Brake | 18,490 | 38.2 | +7.3 | |
| Conservative | Nigel Forman | 16,223 | 33.5 | −16.2 | |
| Labour | Andrew Theobald | 11,565 | 23.9 | +6.2 | |
| Referendum | Julian Storey | 1,289 | 2.7 | N/A | |
| Green | Peter Hickson | 377 | 0.8 | -0.4 | |
| BNP | Gary Ritchie | 261 | 0.5 | N/A | |
| UKIP | Leslie Povey | 218 | 0.5 | N/A | |
| Majority | 2,267 | 4.7 | N/A | ||
| Turnout | 48,424 | 73.3 | −7.6 | ||
| Registered electors | 66,064 | ||||
| Liberal Democrats gain from Conservative | Swing | +11.8 | |||
| Party | Candidate | Votes | % | ± | |
|---|---|---|---|---|---|
| Conservative | Nigel Forman | 26,243 | 49.7 | −4.3 | |
| Liberal Democrats | Tom Brake | 16,300 | 30.9 | +4.7 | |
| Labour | Margaret Moran | 9,333 | 17.7 | −0.5 | |
| Green | Robert Steel | 614 | 1.2 | −0.4 | |
| Loony Green | D Bamford | 266 | 0.5 | N/A | |
| Majority | 9,943 | 18.8 | -9.0 | ||
| Turnout | 52,755 | 80.9 | +5.9 | ||
| Registered electors | 65,179 | ||||
| Conservative hold | Swing | −4.5 | |||
Elections in the 1980s
| Party | Candidate | Votes | % | ± | |
|---|---|---|---|---|---|
| Conservative | Nigel Forman | 27,984 | 54.0 | +2.7 | |
| SDP | John Douglas Grant | 13,575 | 26.2 | −3.4 | |
| Labour | Johanna Baker | 9,440 | 18.2 | +0.7 | |
| Green | Robert Steel | 843 | 1.6 | ±0.0 | |
| Majority | 14,409 | 27.8 | +6.1 | ||
| Turnout | 51,840 | 75.0 | +3.0 | ||
| Registered electors | 69,120 | ||||
| Conservative hold | Swing | +3.1 | |||
| Party | Candidate | Votes | % | ± | |
|---|---|---|---|---|---|
| Conservative | Nigel Forman | 25,396 | 51.3 | 0.0 | |
| SDP | B.J.M. Ensor | 14,641 | 29.6 | +13.9 | |
| Labour | Johanna Baker | 8,655 | 17.5 | -13.7 | |
| Ecology | Robert Steel | 784 | 1.6 | N/A | |
| Majority | 10,755 | 21.7 | +1.6 | ||
| Turnout | 49,478 | 72.0 | -4.7 | ||
| Registered electors | 68,682 | ||||
| Conservative win (new seat) | |||||
See also
- List of Parliamentary constituencies in Greater London
References
- "Carshalton and Wallington: Usual Resident Population, 2011". Neighbourhood Statistics. Office for National Statistics. Retrieved 16 February 2015.
- "Carshalton & Wallington". UK Polling Report. Retrieved 2016-07-24.
- "Carshalton and Wallington 1983-". Hansard 1803-2005. UK Parliament. Retrieved 2 February 2015.
- Leigh Rayment's Historical List of MPs – Constituencies beginning with "C" (part 3)
- Council, Sutton. "Statement of Persons Nominated & Notice of Poll - Carshalton & Wallington 2019 | Sutton Council". www.sutton.gov.uk. Retrieved 2019-11-19.
- "Carshalton & Wallington parliamentary constituency". BBC News.
- http://researchbriefings.files.parliament.uk/documents/CBP-7979/CBP-7979.pdf
- "Election Data 2015". Electoral Calculus. Archived from the original on 17 October 2015. Retrieved 17 October 2015.
- "Election Data 2010". Electoral Calculus. Archived from the original on 26 July 2013. Retrieved 17 October 2015.
- "Election Data 2005". Electoral Calculus. Archived from the original on 15 October 2011. Retrieved 18 October 2015.
- "Election Data 2001". Electoral Calculus. Archived from the original on 15 October 2011. Retrieved 18 October 2015.
- "Election Data 1997". Electoral Calculus. Archived from the original on 15 October 2011. Retrieved 18 October 2015.
- "Carshalton & Wallington". Politicsresources.net. Archived from the original on 2016-06-03. Retrieved 2016-07-24.
- "Election Data 1992". Electoral Calculus. Archived from the original on 15 October 2011. Retrieved 18 October 2015.
- "UK General Election results: April 1992". Politicsresources.net. 1992-04-09. Archived from the original on 2011-08-11. Retrieved 2016-07-24.
- "Election Data 1987". Electoral Calculus. Archived from the original on 15 October 2011. Retrieved 18 October 2015.
- "UK General Election results: June 1987". Politicsresources.net. 1987-06-11. Archived from the original on 2012-03-05. Retrieved 2016-07-24.
- "Election Data 1983". Electoral Calculus. Archived from the original on 15 October 2011. Retrieved 18 October 2015.
- "UK General Election results: June 1983". Politicsresources.net. 1983-06-09. Archived from the original on 2010-01-17. Retrieved 2016-07-24.
External links
- nomis Constituency Profile for Carshalton and Wallington — presenting data from the ONS annual population survey and other official statistics.
- Politics Resources (Election results from 1922 onwards)
- Electoral Calculus (Election results from 1955 onwards)