2012 Highland Council election
The 2012 Highland Council election took place on 3 May 2012 to elect members of Highland Council. The election used the twenty-two wards created as a result of the Local Governance (Scotland) Act 2004, with each ward electing three or four Councillors using the single transferable vote system (a form of proportional representation) and 80 Councillors being elected.
| |||||||||||||||||||||||||||||||||||||||||||||||||||||||||||||
All 80 seats to Highland Council 41 seats needed for a majority | |||||||||||||||||||||||||||||||||||||||||||||||||||||||||||||
|---|---|---|---|---|---|---|---|---|---|---|---|---|---|---|---|---|---|---|---|---|---|---|---|---|---|---|---|---|---|---|---|---|---|---|---|---|---|---|---|---|---|---|---|---|---|---|---|---|---|---|---|---|---|---|---|---|---|---|---|---|---|
| |||||||||||||||||||||||||||||||||||||||||||||||||||||||||||||
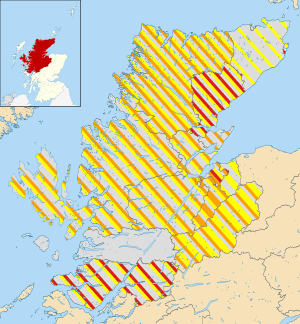 Results by ward. | |||||||||||||||||||||||||||||||||||||||||||||||||||||||||||||
| |||||||||||||||||||||||||||||||||||||||||||||||||||||||||||||
The election saw Independent Councillors remain the largest group, while the Scottish National Party increased their representation, replacing the Scottish Liberal Democrats in second place. The Scottish Labour Party also gained an additional seat. Following the election an administration was formed between the Scottish National Party, the Scottish Liberal Democrats and the Scottish Labour Party. This was the first time that the Independents have not had any role in the administration of the Council.
Election result
| Party | Seats | Gains | Losses | Net gain/loss | Seats % | Votes % | Votes | +/− | |
|---|---|---|---|---|---|---|---|---|---|
| Independent | 35 | 2 | 2 | - | 43.75 | 40.23 | 29,149 | -0.67 | |
| SNP | 22 | 5 | 0 | +5 | 27.5 | 25.77 | 18,673 | +5.37 | |
| Liberal Democrats | 15 | 1 | 7 | -6 | 18.75 | 13.49 | 9,777 | -5.81 | |
| Labour | 8 | 2 | 1 | +1 | 10.0 | 12.63 | 9,151 | +2.13 | |
| Conservative | 0 | - | - | - | - | 5.05 | 3,660 | -2.05 | |
| Scottish Christian | 0 | - | - | - | - | 1.13 | 817 | - | |
| Scottish Green | 0 | - | - | - | 0.96 | 692 | +0.26 | ||
| UKIP | 0 | - | - | - | - | 0.38 | 272 | - | |
| Scottish Senior Citizens | 0 | - | - | - | - | 0.27 | 196 | -0.43 | |
| TUSC | 0 | - | - | - | - | 0.1 | 73 | - | |
Note: "Votes" are the first preference votes. The net gain/loss and percentage changes relate to the result of the previous Scottish local elections on 3 May 2007. This may differ from other published sources showing gain/loss relative to seats held at dissolution of Scotland's councils.
Ward results
North, West and Central Sutherland
- 2007: 1xSNP; 1xLib Dem; 1xIndependent
- 2012: 1xSNP; 1xLib Dem; 1xIndependent
- 2007-2012 Change: No change
| North, West and Central Sutherland - 3 seats | ||||||||||||
|---|---|---|---|---|---|---|---|---|---|---|---|---|
| Party | Candidate | FPv% | Count 1 | Count 2 | Count 3 | Count 4 | Count 5 | Count 6 | Count 7 | Count 8 | ||
| SNP | George Farlow (incumbent) | 26.23% | 626 | |||||||||
| Independent | Hugh Morrison | 22.5% | 537 | 541.5 | 554.9 | 563.9 | 601.3 | |||||
| Liberal Democrats | Linda Munro (incumbent)††††††††† | 18.89% | 451 | 455.6 | 478.7 | 506.8 | 529.2 | 530.5 | 566.7 | 613.4 | ||
| Scottish Senior Citizens | Russell Taylor | 8.21% | 196 | 199.1 | 210.5 | 225.6 | 235.8 | 236.2 | 257.7 | 349 | ||
| Independent | Neil MacInnes | 7.21% | 172 | 175.4 | 180.1 | 190.1 | 198.4 | 198.9 | 234.1 | |||
| Scottish Christian | Hector MacLennan | 5.32% | 127 | 127.9 | 129.1 | 140.2 | 147.2 | 147.6 | ||||
| Conservative | Les Mason | 4.06% | 97 | 97.5 | 100.6 | |||||||
| Independent | Jess Thomas | 4.02% | 96 | 97.7 | 110.5 | 118.5 | ||||||
| Scottish Green | Mandy Haggith | 3.56% | 85 | 89.9 | ||||||||
| Electorate: 4,913 Valid: 2,387 Spoilt: 16 Quota: 597 Turnout: 2,403 (48.91%) | ||||||||||||
Thurso
- 2007: 2xIndependent; 1xLib Dem
- 2012: 2xIndependent; 1xLab
- 2007-2012 Change: Lab gain one seat from Lib Dem
| Thurso - 3 seats | |||||||||||
|---|---|---|---|---|---|---|---|---|---|---|---|
| Party | Candidate | FPv% | Count 1 | Count 2 | Count 3 | Count 4 | Count 5 | Count 6 | Count 7 | ||
| Independent | Donnie MacKay (incumbent) | 29.38% | 703 | ||||||||
| Labour | Roger Saxon | 25.32% | 606 | ||||||||
| SNP | Don Smith | 17.97% | 430 | 444.1 | 445.3 | 448.5 | 465.6 | 514.1 | |||
| Independent | John Rosie (incumbent) | 12.49% | 299 | 357.7 | 359.8 | 369.7 | 413.5 | 518.2 | 708.7 | ||
| Liberal Democrats | Nick Noble | 9.40% | 225 | 234.9 | 235.9 | 248.4 | 266.3 | ||||
| Independent | Ian Grant | 3.68% | 88 | 95.1 | 95.9 | 105.3 | |||||
| Conservative | Reg Holder | 1.76% | 42 | 43.9 | 44.1 | ||||||
| Electorate: 6,192 Valid: 2,393 Spoilt: 33 Quota: 599 Turnout: 2,426 (39.18%) | |||||||||||
Wick
- 2007: 2xIndependent; 1xLib Dem
- 2012: 1xSNP; 1xLab; 1xIndependent
- 2007-2012 Change: SNP and Lab gain one seat from Lib Dem and Independent
| Wick - 3 seats | |||||||||
|---|---|---|---|---|---|---|---|---|---|
| Party | Candidate | FPv% | Count 1 | Count 2 | Count 3 | Count 4 | Count 5 | ||
| SNP | Gail Ross (incumbent) | 46.21% | 798 | ||||||
| Labour | Neil MacDonald | 23.68% | 409 | 506.2 | |||||
| Independent | Bill Fernie (incumbent) | 14.13% | 244 | 320.6 | 338.2 | 373.6 | 488.3 | ||
| Independent | Graeme Smith (incumbent) | 8.86% | 153 | 189.7 | 202.9 | 232.3 | |||
| Conservative | Andrew Sinclair | 7.12% | 123 | 154.2 | 166.9 | ||||
| Electorate: 5,633 Valid: 1,727 Spoilt: 19 Quota: 432 Turnout: 1,746 (31.0%) | |||||||||
Landward Caithness
- 2007: 2xIndependent; 1xSNP; 1xLib Dem
- 2012: 3xIndependent; 1xSNP
- 2007-2012 Change: Independent gain one seat from Lib Dem
| Landward Caithness - 4 seats | ||||||||||||
|---|---|---|---|---|---|---|---|---|---|---|---|---|
| Party | Candidate | FPv% | Count 1 | Count 2 | Count 3 | Count 4 | Count 5 | Count 6 | Count 7 | Count 8 | ||
| Independent | A. I. Willie MacKay (incumbent) | 28.58% | 1,015 | |||||||||
| Independent | David Bremner (incumbent) | 18.33% | 651 | 721.4 | ||||||||
| Independent | Robert Coghill (incumbent) ††††† | 17.97% | 638 | 749.7 | ||||||||
| SNP | Alex MacLeod †††† | 15.49% | 550 | 576.7 | 579.6 | 580.8 | 592.8 | 598.5 | 656.8 | 756.3 | ||
| Labour | David Baron | 8.51% | 302 | 312.5 | 316.5 | 317.6 | 324.7 | 343.9 | 397.2 | |||
| Independent | Bill Mowat | 6.87% | 244 | 274.2 | 282.7 | 284.9 | 297 | 329.2 | ||||
| Conservative | Richard White | 3.07% | 109 | 112.6 | 115.2 | 115.6 | 118.1 | |||||
| Independent | John Campbell | 1.18% | 42 | 54.3 | 57.2 | 58.1 | ||||||
| Electorate: 8,546 Valid: 3,551 Spoilt: 36 Quota: 711 Turnout: 3,587 (41.97%) | ||||||||||||
East Sutherland and Edderton
- 2007: 1xLib Dem; 1xLab; 1xIndependent
- 2012: 1xLab; 1xIndependent; 1xSNP
- 2007-2012 Change: SNP gain one seat from Lib Dem
| East Sutherland and Edderton - 3 seats | |||||||||||
|---|---|---|---|---|---|---|---|---|---|---|---|
| Party | Candidate | FPv% | Count 1 | Count 2 | Count 3 | Count 4 | Count 5 | Count 6 | Count 7 | ||
| Labour | Deirdre MacKay (incumbent) | 32.21% | 966 | ||||||||
| Independent | Jim McGillivray (incumbent) | 19.27% | 578 | 622 | 642.9 | 691.2 | 811 | ||||
| SNP | Graham Phillips | 17.34% | 520 | 544.6 | 548 | 554.7 | 605.8 | 618.1 | 771.7 | ||
| Independent | Richard Gale | 12.74% | 382 | 424.5 | 442.8 | 485.3 | 567.8 | 585.7 | |||
| Liberal Democrats | Robbie Rowantree * | 9.67% | 290 | 334.5 | 340.1 | 402.1 | |||||
| Conservative | Kerensa Carr | 6.27% | 188 | 198.5 | 220.6 | ||||||
| UKIP | Annie Murray | 2.5% | 75 | 81.9 | |||||||
| Electorate: 6,179 Valid: 2,999 Spoilt: 36 Quota: 750 Turnout: 3,034 (49.1%) | |||||||||||
* = Sitting Councillor from a different Ward.
Wester Ross, Strathpeffer and Lochalsh
- 2007: 2xIndependent; 1xSNP; 1xLib Dem
- 2012: 2xIndependent; 1xLib Dem; 1xSNP
- 2007-2012 Change: No change
| Wester Ross, Strathpeffer and Lochalsh - 4 seats | |||||||||||
|---|---|---|---|---|---|---|---|---|---|---|---|
| Party | Candidate | FPv% | Count 1 | Count 2 | Count 3 | Count 4 | Count 5 | Count 6 | Count 7 | ||
| Liberal Democrats | Biz Campbell† (incumbent) | 27.59% | 1,162 | ||||||||
| Independent | Richard Greene (incumbent) | 20.68% | 871 | ||||||||
| Independent | Audrey Sinclair (incumbent) | 16.08% | 677 | 802.7 | 811.9 | 941.6 | |||||
| SNP | Ian Cockburn | 15.01% | 632 | 670.2 | 672.9 | 697.1 | 708.9 | 740.6 | 1,107.2 | ||
| SNP | Paul Monaghan | 8.98% | 378 | 388.2 | 389.5 | 407.5 | 418.2 | 436.8 | |||
| Conservative | Alaine MacDonald | 6.1% | 257 | 284.7 | 286.3 | 303.2 | 315.4 | ||||
| Independent | Richard Mitchell | 5.56% | 234 | 265 | 271.8 | ||||||
| Electorate: 9,612 Valid: 4,211 Spoilt: 62 Quota: 843 Turnout: 4,273 (44.45%) | |||||||||||
Cromarty Firth
- 2007: 2xIndependent; 1xSNP; 1xLib Dem
- 2012: 2xIndependent; 1xSNP; 1xLib Dem
- 2007-2012 Change: No change
| Cromarty Firth - 4 seats | |||||||||||
|---|---|---|---|---|---|---|---|---|---|---|---|
| Party | Candidate | FPv% | Count 1 | Count 2 | Count 3 | Count 4 | Count 5 | Count 6 | Count 7 | ||
| Independent | Carolyn Wilson (incumbent) | 23.60% | 768 | ||||||||
| SNP | Maxine Smith (incumbent) | 17.95% | 584 | 604.7 | 606.9 | 660.8 | |||||
| SNP | Sheila Fletcher | 14.26% | 464 | 469.5 | 470.6 | 489.2 | 494.9 | 547.95 | |||
| Independent | Mike Finlayson (incumbent) | 11.95% | 389 | 429.4 | 452.3 | 519 | 519.8 | 621.3 | 777.1 | ||
| Liberal Democrats | Martin Rattray (incumbent)††† | 11.09% | 361 | 378.7 | 394.6 | 481.4 | 483.4 | 547.96 | 630.9 | ||
| Labour | John McInnes | 9.96% | 324 | 332.2 | 336.5 | 367.4 | 367.9 | ||||
| Independent | Tina Deborah McCaffery | 9.19% | 299 | 307.1 | 313.2 | ||||||
| Conservative | Jane Rous | 1.99% | 65 | 68.5 | |||||||
| Electorate: 9,456 Valid: 3,254 Spoilt: 65 Quota: 651 Turnout: 3,319 (35.1%) | |||||||||||
Tain and Easter Ross
- 2007: 2xIndependent; 1xLib Dem
- 2012: 2xIndependent; 1xLib Dem
- 2007-2012 Change: No change
| Tain and Easter Ross - 3 seats | |||||||||||
|---|---|---|---|---|---|---|---|---|---|---|---|
| Party | Candidate | FPv% | Count 1 | Count 2 | Count 3 | Count 4 | Count 5 | Count 6 | Count 7 | ||
| Independent | Alasdair Rhind (incumbent) | 32.67% | 1,008 | ||||||||
| Independent | Fiona Robertson (incumbent) | 24.44% | 754 | 861.9 | |||||||
| Liberal Democrats | Jamie Stone | 16.47% | 508 | 560.7 | 591.2 | 598.9 | 611.6 | 639.2 | 774.9 | ||
| SNP | Charlie Falconer | 13.61% | 420 | 432.2 | 441.8 | 446.8 | 450.9 | 468.8 | 514.8 | ||
| Independent | Richard Durham (incumbent) | 8.14% | 250 | 284.9 | 312.6 | 315.9 | 333.2 | 347.2 | |||
| Labour | Ron Stevenson | 2.53% | 78 | 81 | 82.8 | 86.2 | 89.6 | ||||
| Conservative | David Rutherford | 1.43% | 44 | 48.7 | 52.3 | 54.1 | |||||
| TUSC | Sean Robertson | 0.74% | 23 | 24.9 | 27.2 | ||||||
| Electorate: 7,051 Valid: 3,085 Spoilt: 21 Quota: 772 Turnout: 3,106 (44.05%) | |||||||||||
Dingwall and Seaforth
- 2007: 2xIndependent; 1xLib Dem; 1xSNP
- 2012: 2xIndependent; 1xLib Dem; 1xSNP
- 2007-2012 Change: No change
| Dingwall and Seaforth - 4 seats | ||||||||||||||
|---|---|---|---|---|---|---|---|---|---|---|---|---|---|---|
| Party | Candidate | FPv% | Count 1 | Count 2 | Count 3 | Count 4 | Count 5 | Count 6 | Count 7 | Count 8 | Count 9 | Count 10 | ||
| Independent | Margaret Paterson (incumbent) | 20.98% | 748 | |||||||||||
| Liberal Democrats | Angela MacLean (incumbent) | 16.77% | 598 | 607.4 | 613.5 | 646.7 | 693.3 | 768.2 | ||||||
| SNP | Graham MacKenzie | 12.20% | 435 | 440.5 | 441.5 | 441.5 | 465.9 | 495.9 | 503.2 | 835.7 | ||||
| Labour | John Erskine | 11.78% | 420 | 422.8 | 424.8 | 429.9 | 448.9 | 486.1 | 495.8 | 533.5 | 554.6 | |||
| SNP | Peter Cairns (incumbent) | 10.88% | 388 | 389.3 | 393.3 | 396.3 | 406.4 | 438.5 | 443.4 | |||||
| Independent | David Chisholm (incumbent) | 8.36% | 298 | 300.4 | 305.4 | 318.6 | 349.2 | |||||||
| Independent | Alister MacKinnon | 7.57% | 270 | 274 | 298.2 | 315.3 | 405.5 | 507.4 | 521.4 | 543.2 | 564.7 | 718.6 | ||
| Independent | Fred Lees | 6.17% | 220 | 223.8 | 258.9 | 270.1 | ||||||||
| Conservative | Matthew MacDonald | 2.78% | 99 | 99.99 | 104.99 | |||||||||
| Scottish Christian | David Forbes | 2.52% | 90 | 90.50 | ||||||||||
| Electorate: 9,256 Valid: 3,566 Spoilt: 48 Quota: 714 Turnout: 3,614 (39.04%) | ||||||||||||||
Black Isle
- 2007: 2xIndependent; 1xLib Dem; 1xSNP
- 2012: 2xIndependent; 1xLib Dem; 1xSNP
- 2007-2012 Change: No change
| Black Isle - 4 seats | ||||||||||||||
|---|---|---|---|---|---|---|---|---|---|---|---|---|---|---|
| Party | Candidate | FPv% | Count 1 | Count 2 | Count 3 | Count 4 | Count 5 | Count 6 | Count 7 | Count 8 | Count 9 | Count 10 | ||
| Independent | Billy Barclay (incumbent)†††††† | 26.77% | 1,130 | |||||||||||
| Independent | Isobel McCallum (incumbent) | 16.04% | 677 | 759.7 | 776.9 | 815.7 | 868.8 | |||||||
| Liberal Democrats | David Alston (incumbent) | 15.3% | 646 | 691.4 | 698.9 | 742.7 | 789.2 | 795.4 | 842.5 | 912.9 | ||||
| SNP | Craig Fraser (incumbent) | 14.45% | 610 | 636.5 | 640.5 | 649.7 | 678.7 | 681.5 | 713.6 | 755 | 767.8 | 917 | ||
| Scottish Green | Myra Carus | 6.92% | 292 | 308.9 | 311.9 | 318.7 | 349.9 | 351.6 | 390.5 | 438.9 | 458.8 | |||
| Independent | Morris MacKenzie Downie | 5.69% | 240 | 276.8 | 283.8 | 296.3 | 302.8 | 306.5 | 358.6 | |||||
| Labour | Michael MacMillan | 5.12% | 216 | 226.1 | 229.3 | 230.6 | ||||||||
| Independent | Okain McLennan | 5.03% | 212 | 236.7 | 242.5 | 249.2 | 265.5 | 269.1 | ||||||
| Conservative | Pamela Cornwell | 3.34% | 141 | 149.3 | 153.1 | |||||||||
| Scottish Christian | Paul Horwood | 1.35% | 57 | 60.5 | ||||||||||
| Electorate: 8,205 Valid: 4,221 Spoilt: 39 Quota: 845 Turnout: 4,260 (51.92%) | ||||||||||||||
Eilean a' Cheò
- 2007: 2xIndependent; 1xLib Dem; 1xSNP
- 2012: 2xIndependent; 1xSNP; 1xLib Dem
- 2007-2012 Change: No change
| Eilean a' Cheò - 4 seats | |||||||
|---|---|---|---|---|---|---|---|
| Party | Candidate | FPv% | Count 1 | Count 2 | Count 3 | ||
| Independent | John Gordon | 26.59% | 949 | ||||
| SNP | Ian Renwick (incumbent) | 23.26% | 830 | ||||
| Independent | Hamish Fraser (incumbent) | 18.13% | 647 | 702.5 | 729.6 | ||
| Liberal Democrats | Drew Millar (incumbent)††† | 17.96% | 641 | 704.1 | 726.4 | ||
| Independent | Moira Scoobie | 7.12% | 254 | 301 | 317.1 | ||
| Labour | Andrew MacKintosh | 4.4% | 157 | 164.7 | 171.5 | ||
| Conservative | John Crews | 2.55% | 91 | 97.4 | 99.8 | ||
| Electorate: 8,161 Valid: 3,569 Spoilt: 40 Quota: 714 Turnout: 3,609 (44.22%) | |||||||
Caol and Mallaig
- 2007: 3xIndependent
- 2012: 3xIndependent
- 2007-2012 Change: No change
| Caol and Mallaig - 3 seats | |||||||||||
|---|---|---|---|---|---|---|---|---|---|---|---|
| Party | Candidate | FPv% | Count 1 | Count 2 | Count 3 | Count 4 | Count 5 | Count 6 | Count 7 | ||
| Independent | Allan Henderson (incumbent) | 32.64% | 905 | ||||||||
| Independent | Bill Clark†† (incumbent) | 25.59% | 710 | ||||||||
| Independent | Eddie Hunter (incumbent)††††††† | 18.24% | 506 | 627.7 | 636.1 | 648.9 | 676.2 | 691.9 | 731.2 | ||
| SNP | Niall Rownatree | 14.82% | 411 | 436.9 | 438.6 | 448.1 | 459.3 | 474 | 492.4 | ||
| Independent | George Kerr | 2.56% | 71 | 83.1 | 84.4 | 88.7 | 95.2 | 106.1 | |||
| Conservative | Elizabeth Saggers | 2.38% | 66 | 73.7 | 74.1 | 77.4 | 80.6 | ||||
| Independent | Sally Semple | 2.16% | 60 | 66.9 | 67.5 | 71.2 | |||||
| Scottish Christian | Susan Wallace | 1.62% | 45 | 50 | 50 | ||||||
| Electorate: 6,752 Valid: 2,774 Spoilt: 44 Quota: 694 Turnout: 2,818 (41.74%) | |||||||||||
Aird and Loch Ness
- 2007: 2xIndependent; 1xSNP; 1xLib Dem
- 2012: 2xIndependent; 1xSNP; 1xLib Dem
- 2007-2012 Change: No change
| Aird and Loch Ness - 4 seats | ||||||||||||
|---|---|---|---|---|---|---|---|---|---|---|---|---|
| Party | Candidate | FPv% | Count 1 | Count 2 | Count 3 | Count 4 | Count 5 | Count 6 | Count 7 | Count 8 | ||
| Independent | Margaret Davidson (incumbent) | 36.94% | 1,194 | |||||||||
| SNP | Drew Hendry (incumbent)†††††††††† | 20.77% | 840 | |||||||||
| Independent | Helen Carmichael (incumbent) | 16.3% | 659 | 894.4 | ||||||||
| Liberal Democrats | Hamish Wood (incumbent) | 12.31% | 498 | 546 | 575.4 | 579 | 585.9 | 652.4 | 768 | 858.1 | ||
| SNP | Robert Stewart | 7.1% | 287 | 314.1 | 322.7 | 345.3 | 358.5 | 387 | 413.2 | |||
| Conservative | George Cruickshank | 6.89% | 279 | 297.4 | 307.4 | 307.9 | 335.8 | 351.9 | ||||
| Labour | Mike Robb | 5.46% | 221 | 234.2 | 242.1 | 243.3 | 246.2 | |||||
| UKIP | Fred Pidcock | 1.63% | 66 | 72.1 | 75.8 | 76.3 | ||||||
| Electorate: 8,999 Valid: 4,044 Spoilt: 56 Quota: 809 Turnout: 4,100 (45.56%) | ||||||||||||
Inverness West
- 2007: 1xSNP; 1xLib Dem; 1xIndependent
- 2012: 1xLib Dem; 1xIndependent; 1xSNP
- 2007-2012 Change: No change
| Inverness West - 3 seats | |||||||||||
|---|---|---|---|---|---|---|---|---|---|---|---|
| Party | Candidate | FPv% | Count 1 | Count 2 | Count 3 | Count 4 | Count 5 | Count 6 | Count 7 | ||
| Liberal Democrats | Alex Graham (incumbent) | 24.68% | 610 | 613 | 615 | 650 | |||||
| Independent | Graham Ross | 23.46% | 580 | 594 | 611 | 639 | |||||
| SNP | Allan Duffy | 18.53% | 458 | 467 | 472 | 481 | 485.9 | 488.4 | 725.9 | ||
| Labour | Robert Ford | 13.88% | 343 | 349 | 355 | 359 | 366.1 | 369.9 | 393.8 | ||
| SNP | Pauline Munro (incumbent) | 11.37% | 281 | 288 | 295 | 296 | 301.6 | 305.5 | |||
| Conservative | Mary Fraser | 3.8% | 94 | 94 | 107 | ||||||
| Scottish Christian | Alan Petitt | 2.27% | 56 | 60 | |||||||
| TUSC | George MacDonald | 2.02% | 50 | ||||||||
| Electorate: 6,659 Valid: 2,472 Spoilt: 41 Quota: 619 Turnout: 2,513 (37.74%) | |||||||||||
Inverness Central
- 2007: 1xSNP; 1xIndependent; 1xLib Dem; 1xLab
- 2012: 2xSNP; 1xIndependent; 1xLab
- 2007-2012 Change: SNP gain one seat from Lib Dem
| Inverness Central - 4 seats | |||||||||||
|---|---|---|---|---|---|---|---|---|---|---|---|
| Party | Candidate | FPv% | Count 1 | Count 2 | Count 3 | Count 4 | Count 5 | Count 6 | Count 7 | ||
| Independent | Janet Campbell (incumbent) | 29.97% | 887 | ||||||||
| Labour | Bet McAllister (incumbent) | 26.36% | 867 | ||||||||
| SNP | Donnie Kerr††† (incumbent) | 20.43% | 672 | ||||||||
| SNP | Richard Laird | 11.49% | 378 | 420.6 | 462.5 | 473.6 | 490.2 | 500.5 | 619.6 | ||
| Liberal Democrats | Angus Dick | 9.64% | 257 | 316.9 | 360 | 360.6 | 372.9 | 452.8 | |||
| Conservative | Ray Doctor | 7.81% | 153 | 175.7 | 184.4 | 184.6 | 210.8 | ||||
| Scottish Christian | Rich Omand | 2.28% | 75 | 91 | 103.5 | 103.9 | |||||
| Electorate: 9,251 Valid: 3,289 Spoilt: 59 Quota: 658 Turnout: 3,348 (36.19%) | |||||||||||
Inverness Ness-side
- 2007: 1xLib Dem; 1xSNP; 1xIndependent; 1xLab
- 2012: 1xSNP; 1xLib Dem; 1xLab; 1xIndependent
- 2007-2012 Change: No change
| Inverness Ness-side - 4 seats | |||||||||
|---|---|---|---|---|---|---|---|---|---|
| Party | Candidate | FPv% | Count 1 | Count 2 | Count 3 | Count 4 | Count 5 | ||
| SNP | Jean Slater | 23.75% | 879 | ||||||
| Liberal Democrats | Alasdair Christie * | 21.48% | 795 | ||||||
| Labour | Fraser Parr (incumbent) | 17.83% | 660 | 693.9 | 705.5 | 722.9 | 776.8 | ||
| Independent | Norrie Donald (incumbent) | 16.78% | 621 | 653.9 | 671.2 | 712.1 | 863.7 | ||
| Conservative | Peter Guthrie | 8.97% | 332 | 337.5 | 347.1 | 367.9 | 400.9 | ||
| Independent | John West | 8.05% | 298 | 314.6 | 319.7 | 332.6 | |||
| Scottish Christian | Alasdair Moodie | 3.13% | 116 | 122.3 | 123.9 | ||||
| Electorate: 8,822 Valid: 3,701 Spoilt: 33 Quota: 741 Turnout: 3,734 (42.33%) | |||||||||
* = Sitting Councillor from a different Ward.
Inverness Millburn
- 2007: 1xLab; 1xSNP; 1xLib Dem
- 2012: 1xLab; 1xSNP; 1xLib Dem
- 2007-2012 Change: No change
| Inverness Millburn - 3 seats | ||||||||||
|---|---|---|---|---|---|---|---|---|---|---|
| Party | Candidate | FPv% | Count 1 | Count 2 | Count 3 | Count 4 | Count 5 | Count 6 | ||
| Labour | Jimmy Gray (incumbent) | 45.75% | 1,152 | |||||||
| SNP | Ian Brown (incumbent) | 29.90% | 753 | |||||||
| Liberal Democrats | Ken MacLeod (incumbent) | 7.94% | 200 | 349.1 | 373.6 | 400.6 | 495.8 | 636.9 | ||
| Conservative | Peter Saggers | 7.03% | 177 | 213.7 | 219.1 | 235.8 | ||||
| Scottish Green | Anne Thomas | 5.76% | 145 | 272.3 | 304.5 | 332.9 | 367.2 | |||
| Scottish Christian | Clark Walls | 3.61% | 91 | 120.9 | 128.7 | |||||
| Electorate: 6,377 Valid: 2,518 Spoilt: 22 Quota: 630 Turnout: 2,540 (40.08%) | ||||||||||
Culloden and Ardersier
- 2007: 1xSNP; 1xIndependent; 1xLab; 1xLib Dem
- 2012: 1xIndependent; 1xLib Dem; 1xSNP; 1xLab
- 2007-2012 Change: No change
| Culloden and Ardersier - 4 seats | ||||||||||||
|---|---|---|---|---|---|---|---|---|---|---|---|---|
| Party | Candidate | FPv% | Count 1 | Count 2 | Count 3 | Count 4 | Count 5 | Count 6 | Count 7 | Count 8 | ||
| Independent | Roddy Balfour (incumbent) | 29.71% | 1,023 | |||||||||
| SNP | Glynis Sinclair (incumbent) | 16.44% | 566 | 616.6 | 618.6 | 621.9 | 648.1 | 678 | 682.3 | 1,024.6 | ||
| Labour | John Ford (incumbent)†††††††††††† | 13.91% | 479 | 509.4 | 514.3 | 524.3 | 547.6 | 586.8 | 595.9 | 644.3 | ||
| Liberal Democrats | Kate Stephen | 13.8% | 475 | 530.8 | 535.8 | 618.6 | 668.4 | 728.5 | ||||
| SNP | Bob Wynd (incumbent) | 10.89% | 375 | 390.7 | 393.9 | 402.7 | 429.9 | 455.2 | 459.6 | |||
| Scottish Green | Donnie MacLeod | 4.93% | 170 | 209.2 | 219.1 | 227.4 | ||||||
| Independent | David McGrath | 4.79% | 165 | 192.1 | 238.1 | 261.9 | 300.9 | |||||
| Conservative | Alex Stephen | 4.47% | 154 | 177.2 | 178.8 | |||||||
| Independent | Bill Jamieson | 1.05% | 36 | 82.4 | ||||||||
| Electorate: 8,606 Valid: 3,443 Spoilt: 36 Quota: 689 Turnout: 3,479 (40.43%) | ||||||||||||
Nairn
- 2007: 2xIndependent; 1xSNP; 1xLib Dem
- 2012: 2xIndependent; 2xSNP
- 2007-2012 Change: SNP gain one seat from Lib Dem
| Nairn - 4 seats | |||||||||||
|---|---|---|---|---|---|---|---|---|---|---|---|
| Party | Candidate | FPv% | Count 1 | Count 2 | Count 3 | Count 4 | Count 5 | Count 6 | Count 7 | ||
| SNP | Liz MacDonald (incumbent) | 28.36% | 1,120 | ||||||||
| Independent | Laurie Fraser (incumbent) | 15.73% | 621 | 646 | 684 | 800.1 | |||||
| Independent | Michael Green | 12.23% | 483 | 511.9 | 543.5 | 641.2 | 645.8 | 778.1 | 968.7 | ||
| Labour | Ashley Broadbent | 11.6% | 458 | 468.9 | 479.5 | 516.8 | 517.7 | 606.5 | |||
| SNP | Colin John MacRury MacAulay†††††††† | 10.31% | 407 | 615.3 | 625.5 | 652.1 | 653.1 | 716.4 | 810.4 | ||
| Liberal Democrats | Graham Marsden (incumbent) | 8.38% | 330 | 348.6 | 406.3 | 442.9 | 444.6 | ||||
| Independent | Ritchie Cunningham | 8.23% | 325 | 338.8 | 366.4 | ||||||
| Conservative | Rossie MacRae | 5.19% | 205 | 210 | |||||||
| Electorate: 9,136 Valid: 3,949 Spoilt: 63 Quota: 790 Turnout: 4,012 (43.91%) | |||||||||||
Inverness South
- 2007: 1xSNP; 1xLib Dem; 1xLab; 1xIndependent
- 2012: 2xLib Dem; 1xSNP; 1xIndependent
- 2007-2012 Change: Lib Dem gain one seat from Lab
| Inverness South - 4 seats | ||||||||||||
|---|---|---|---|---|---|---|---|---|---|---|---|---|
| Party | Candidate | FPv% | Count 1 | Count 2 | Count 3 | Count 4 | Count 5 | Count 6 | Count 7 | Count 8 | ||
| SNP | Ken Gowans | 20.34% | 696 | |||||||||
| Independent | Jim Crawford (incumbent) | 17.36% | 594 | 594.5 | 659.5 | 772.5 | ||||||
| Liberal Democrats | Carolyn Caddick (incumbent) | 16.63% | 569 | 569.6 | 590.7 | 688.7 | ||||||
| SNP | Bill Boyd | 11.49% | 393 | 401.3 | 411.3 | 429.4 | 437.9 | 438.2 | 495.6 | |||
| Labour | Katherine MacKenzie | 10.32% | 353 | 353.3 | 363.3 | 385.3 | 398.8 | 399.1 | ||||
| Liberal Democrats | Thomas Prag (incumbent) | 9.79% | 335 | 335.2 | 346.2 | 378.2 | 401.4 | 403.9 | 505.3 | 631.9 | ||
| Conservative | David Bonsor | 9.38% | 321 | 321.1 | 343.1 | |||||||
| Scottish Christian | Donald MacLeod Boyd | 4.68% | 160 | 160.1 | ||||||||
| Electorate: 9,479 Valid: 3,421 Spoilt: 37 Quota: 685 Turnout: 3,458 (36.48%) | ||||||||||||
Badenoch and Strathspey
- 2007: 2xIndependent; 1xLib Dem; 1xSNP
- 2012: 2xSNP; 1xIndependent; 1xLib Dem
- 2007-2012 Change: SNP gain one seat from Independent
| Badenoch and Strathspey - 4 seats | ||||||||||
|---|---|---|---|---|---|---|---|---|---|---|
| Party | Candidate | FPv% | Count 1 | Count 2 | Count 3 | Count 4 | Count 5 | Count 6 | ||
| Independent | Jaci Douglas (incumbent) | 24.68% | 1,082 | |||||||
| SNP | Bill Lobban | 17.99% | 789 | 813.3 | 818.9 | 840.1 | 844.8 | 970.6 | ||
| SNP | David Fallows (incumbent)††††††††††† | 16.49% | 723 | 750.3 | 764.5 | 796.6 | 805.8 | 912.2 | ||
| Liberal Democrats | Gregor Rimell (incumbent) | 14.73% | 646 | 707.3 | 720.3 | 927.9 | ||||
| Labour | Kieran Turner | 12.91% | 566 | 596.5 | 610.7 | 640.6 | 653.6 | |||
| Conservative | Les Durance | 10.22% | 448 | 466.5 | 518.1 | |||||
| UKIP | Ross Durance | 2.99% | 131 | 141.4 | ||||||
| Electorate: 10,348 Valid: 4,385 Spoilt: 49 Quota: 878 Turnout: 4,434 (42.85%) | ||||||||||
Fort William and Ardnamurchan
- 2007: 1xLib Dem; 1xIndependent; 1xSNP; 1xLab
- 2012: 2xIndependent; 1xSNP; 1xLab
- 2007-2012 Change: Independent gain one seat from Lib Dem
| Fort William and Ardnamurchan - 4 seats | ||||||||||||
|---|---|---|---|---|---|---|---|---|---|---|---|---|
| Party | Candidate | FPv% | Count 1 | Count 2 | Count 3 | Count 4 | Count 5 | Count 6 | Count 7 | Count 8 | ||
| Independent | Andrew Baxter††† | 18.63% | 647 | 678 | 713 | |||||||
| Labour | Brian Murphy (incumbent) | 16.53% | 574 | 585 | 631 | 633.3 | 688.5 | 719.3 | ||||
| SNP | Bren Gormley (incumbent) | 16.33% | 567 | 577 | 583 | 585.4 | 855.7 | |||||
| Independent | Davie Corrigan | 13.48% | 468 | 489 | 514 | 518.2 | 552.2 | 580.7 | 584.9 | |||
| Independent | Thomas MacLennan††† | 12.9% | 448 | 473 | 518 | 521.8 | 555.9 | 582.7 | 590.1 | 873.3 | ||
| SNP | William MacDonald | 11.9% | 413 | 418 | 434 | 435 | ||||||
| Liberal Democrats | Jamie MacKie | 5.18% | 180 | 219 | ||||||||
| Conservative | Alexander Gillespie | 5.04% | 175 | |||||||||
| Electorate: 8,593 Valid: 3,472 Spoilt: 58 Quota: 695 Turnout: 3,530 (41.08%) | ||||||||||||
Post Election Changes
- † On 5 May 2012 Wester Ross, Strathpeffer and Lochalsh Cllr Biz Campbell quit the Liberal Democrats and became an Independent.
- †† On 18 June 2012 Caol and Mallaig Cllr Bill Clark joined the Scottish National Party and ceased to be an Independent.
- ††† On 16 October 2012 Inverness Central Cllr Donnie Kerr quit the Scottish National Party and became a non-aligned Independent. On 15 December 2014 he joined the Highland Alliance along with former Liberal Democrat Cllrs Drew Millar and Martin Rattray and former Independents Andrew Baxter and Thomas MacLennan.
- †††† On 10 December 2012 Landward Caithness Cllr Alex MacLeod quit the Scottish National Party regarding alleged offences under the Representation of the People Act 1983 and became an Independent Nationalist. He subsequently resigned his seat and a by-election was held on 28 November 2013 which was won by the Independent Matthew Reiss.
- ††††† On 28 February 2013 Landward Caithness Independent Cllr Robert Coghill resigned on medical grounds. A by-election was held on 2 May 2013 and was won by his daughter, Gillian Coghill.
- †††††† On 23 October 2013 Black Isle Independent Cllr Billy Barclay died. A by-election was held on 19 December 2013 to fill the vacancy which was won by his widow, Jennifer, also an Independent.
- ††††††† On 9 January 2014 Caol and Mallaig Independent Cllr Eddie Fisher announced he was resigning from the Council as he is moving away from the region. A by-election was held on 1 May 2014 to fill the vacancy which was won by the Independent, Ben Thompson.
- †††††††† On 15 March 2015 Nairn SNP Cllr Colin John MacRury MacAulay resigned his seat on medical grounds A by-election was held on 7 May 2015 and the seat was held by the SNP's Stephen Fuller.
- ††††††††† On 28 May 2015 North, West and Central Sutherland Cllr Linda Munro quit the Liberal Democrats and became an Independent.
- †††††††††† On 7 May 2015 Aird and Loch Ness SNP Cllr Drew Hendry was elected as an MP for the Inverness, Nairn, Badenoch and Strathspey constituency. He resigned his Council seat on 13 July 2015 and a by-election was held on 8 October 2015. The by-election was won by the Liberal Democrat Dr Jean Davis.
- ††††††††††† On 12 May 2016 Badenoch and Strathspey SNP Cllr David Fallows quit the party over key policies and joined the Highland Alliance.
- †††††††††††† On 21 July 2016 Culloden and Ardersier Labour Cllr John Ford died suddenly while on holiday in Jersey. A by-election was held on 6 October 2016 which was won by the Liberal Democrat's Trish Robertson.
By-elections since 2012
| Landward Caithness By-election (2 May 2013) - 1 Seat[1] | |||||
|---|---|---|---|---|---|
| Party | Candidate | FPv% | Count 1 | ||
| Independent | Gillian Coghill | 53.49 | 1,317 | ||
| SNP | Hanna Miedema | 21.32 | 525 | ||
| Labour | David Baron | 16.94 | 417 | ||
| Conservative | Barbara Anne Watson | 8.25 | 203 | ||
| Electorate: 8,592 Valid: 2,462 Spoilt: 17 Quota: 1,232 Turnout: 2,479 (28.85%) | |||||
| Landward Caithness By-election (28 November 2013) - 1 Seat[2] | ||||||||
|---|---|---|---|---|---|---|---|---|
| Party | Candidate | FPv% | Count 1 | Count 2 | Count 3 | Count 4 | ||
| Independent | Matthew Reiss | 44.4 | 1,150 | |||||
| Independent | Winifred Sutherland | 22.9 | 593 | |||||
| SNP | Ed Boyter | 21.1 | 526 | |||||
| Conservative | Kerensa Carr | 6.6 | 171 | |||||
| Independent | Tina Irving | 4.9 | 128 | |||||
| Caol and Mallaig By-election (1 May 2014) - 1 Seat[3] | ||||||||
|---|---|---|---|---|---|---|---|---|
| Party | Candidate | FPv% | Count 1 | Count 2 | Count 3 | Count 4 | ||
| Independent | Ben Thompson | 38.98 | 932 | 950 | 1,009 | 1,176 | ||
| SNP | William MacDonald | 30.36 | 726 | 739 | 756 | 881 | ||
| Independent | Sandy Watson | 22.46 | 537 | 541 | 551 | |||
| UKIP | Liam Simmonds | 5.56 | 133 | 139 | ||||
| Scottish Christian | Susan Wallace | 2.84 | 68 | |||||
| Black Isle By-election (19 December 2013) - 1 Seat[4] | ||||||||||
|---|---|---|---|---|---|---|---|---|---|---|
| Party | Candidate | FPv% | Count 1 | Count 2 | Count 3 | Count 4 | Count 5 | Count 6 | ||
| Independent | Jennifer Barclay | 32.8 | 1,003 | 1,031 | 1,061 | 1,157 | 1,210 | 1,343 | ||
| SNP | Jackie Hendry | 14.3 | 439 | 439 | 453 | 470 | 530 | 594 | ||
| Independent | Bill Fraser | 12.5 | 382 | 413 | 431 | 486 | 556 | 663 | ||
| Liberal Democrats | George Normington | 10.9 | 334 | 373 | 408 | 434 | 489 | |||
| Independent | Gwyn Phillips | 9.0 | 275 | 289 | 304 | |||||
| Scottish Green | Myra Carus | 8.8 | 269 | 280 | 319 | 362 | ||||
| Labour | Shaun Finlayson | 6.0 | 184 | 194 | ||||||
| Conservative | Douglas MacLean | 5.7 | 175 | |||||||
| Nairn By-election (7 May 2015) - 1 Seat[5] | ||||||||
|---|---|---|---|---|---|---|---|---|
| Party | Candidate | FPv% | Count 1 | Count 2 | Count 3 | Count 4 | ||
| SNP | Stephen Fuller | 41.04 | 2,709 | 2,782 | 2,854 | 3,135 | ||
| Liberal Democrats | Ritchie Cunningham | 24.07 | 1,589 | 1,701 | 1,890 | 2,406 | ||
| Independent | Paul McIvor | 15.32 | 1,011 | 1,042 | 1,440 | |||
| Independent | Mairi MacGregor | 12.68 | 837 | 893 | ||||
| Labour | Chris Johnson | 6.89 | 455 | |||||
| Aird and Loch Ness By-election (8 October 2015) - 1 Seat[6] | ||||||||
|---|---|---|---|---|---|---|---|---|
| Party | Candidate | FPv% | Count 1 | Count 2 | Count 3 | Count 4 | ||
| Liberal Democrats | Jean Mary Elizabeth Davis | 33.5% | 1,029 | 1,099 | 1,208 | 1,511 | ||
| SNP | Emma Ann Knox | 32.5% | 1,000 | 1,097 | 1,144 | 1,167 | ||
| Conservative | George Cruickshank | 15.2% | 467 | 480 | 544 | |||
| Independent | Zofia Fraser | 9.5% | 293 | 330 | ||||
| Scottish Green | Vikki Tania Trelfer | 9.3% | 287 | |||||
| Electorate: 9,584 Valid: 3,076 Spoilt: 24 Quota: 1,538 Turnout: 3,100 (32.35%) | ||||||||
| Culloden and Arderseir By-election (6 October 2016) - 1 Seat[7] | ||||||||||||
|---|---|---|---|---|---|---|---|---|---|---|---|---|
| Party | Candidate | FPv% | Count 1 | Count 2 | Count 3 | Count 4 | Count 5 | Count 6 | Count 7 | Count 8 | ||
| SNP | Pauline Munro | 27.2 | 753 | 755 | 775 | 796 | 862 | 908 | 970 | 1,001 | ||
| Liberal Democrats | Trish Robertson | 16.7 | 463 | 464 | 479 | 515 | 564 | 703 | 793 | 1,026 | ||
| Conservative | Andrew Jarvie | 15.9 | 439 | 442 | 452 | 468 | 478 | 515 | 589 | |||
| Independent | John Ross | 11.4 | 315 | 317 | 330 | 339 | 362 | |||||
| Independent | Duncan MacPherson | 9.9 | 274 | 285 | 324 | 346 | 369 | 414 | ||||
| Scottish Green | Isla MacLeod-O'Reilly | 6.5 | 180 | 182 | 188 | 209 | ||||||
| Labour | Andrew MacKintosh | 5.9 | 163 | 163 | 180 | |||||||
| Independent | David McGrath | 5.7 | 158 | 158 | ||||||||
| Independent | Thomas Lamont | 0.8 | 23 | |||||||||
| Electorate: 9,237 Valid: 2,768 Spoilt: 50 Quota: 1,385 Turnout: 2,818 (30.51%) | ||||||||||||
References
- http://www.highland.gov.uk/yourcouncil/elections/highlandcouncilelections/ward4-results.htm
- http://www.highland.gov.uk/yourcouncil/elections/highlandcouncilelections/ward4-by-election-2013.htm
- http://www.highland.gov.uk/downloads/file/6421/preference_summary_report_-_caol_and_mallaig_by-election_may_2014
- http://www.scottishelections.org.uk/scotland/lby/blackisle.php
- http://www.highland.gov.uk/press/article/43/five_candidates_contest_nairn_by-election
- http://www.highland.gov.uk/info/799/elections_and_voting/371/elections/2
- http://www.highland.gov.uk/info/799/elections_and_voting/706/culloden_and_ardersier_by-election