2011 Manx general election
A general election was held on the Isle of Man on 29 September 2011 to elect 24 members to the island's lower house, the House of Keys. 60,000 residents were eligible to vote, including 16- and 17-year-olds. Successful candidates were sworn in on 4 October 2011.[1] A total of about 34,000 people voted in the election, but some of these were in multi-member constituencies and therefore cast more than one vote.
| |||||||||||||||||||||||||||||
All 24 seats to the House of Keys | |||||||||||||||||||||||||||||
|---|---|---|---|---|---|---|---|---|---|---|---|---|---|---|---|---|---|---|---|---|---|---|---|---|---|---|---|---|---|
| |||||||||||||||||||||||||||||
 | |||||||||||||||||||||||||||||
 |
|---|
| This article is part of a series on the politics and government of the Isle of Man |
Results
| Party | Vote | % | Seats | +/– | |
|---|---|---|---|---|---|
| Liberal Vannin Party | 11,679 | 20.87 | 3 | +1 | |
| Manx Labour Party | 1,749 | 3.12 | 1 | 0 | |
| Independents | 42,543 | 76.01 | 20 | –1 | |
| Total | 55,971 | 100 | 24 | 0 | |
| Valid votes | 34,369 | 99.65 | |||
| Invalid/blank votes | 120 | 0.35 | |||
| Total | 34,489 | 100 | |||
| Registered voters/turnout | 60,382 | 57.12 | |||
| Source: Government of the Isle of Man | |||||
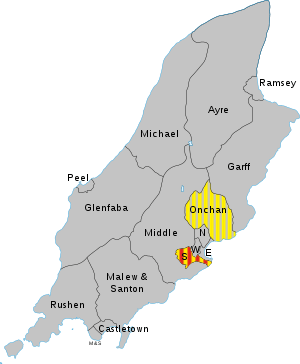
By constituency
| Party | Candidate | Votes | ||
|---|---|---|---|---|
| Count | Of total (%) | |||
| Independent | Eddie Teare | 1,060 | 65.3 | |
| Independent | Andrew Newington-Bridges | 429 | 26.4 | |
| Liberal Vannin | Patrick Ayres | 134 | 8.3 | |
| Total votes | 1,623 | |||
| Total ballots | 1,623 | |||
| Rejected ballots | 9 | |||
| Turnout | 1,632 | 67.4 | ||
| Registered electors | 2,423 | |||
| Party | Candidate | Votes | ||
|---|---|---|---|---|
| Count | Of total (%) | |||
| Independent | Richard Ronan | 520 | 35.5 | |
| Independent | Jason Moorhouse | 479 | 32.7 | |
| Independent | Mahendra Patel | 280 | 19.1 | |
| Independent | Colin Leather | 108 | 7.4 | |
| Independent | Carol Quine | 43 | 2.9 | |
| Independent | David Pownall | 33 | 2.3 | |
| Total votes | 1,463 | |||
| Total ballots | 1,463 | |||
| Rejected ballots | 3 | |||
| Turnout | 1,470 | 65.7 | ||
| Registered electors | 2,237 | |||
| Party | Candidate | Votes | ||
|---|---|---|---|---|
| Count | Of total (%) | |||
| Independent | Chris Robertshaw | 915 | 30.9 | |
| Independent | Brenda Cannell | 757 | 25.5 | |
| Independent | Paul Moulton | 490 | 16.5 | |
| Independent | Geraldine O'Neill | 441 | 14.9 | |
| Independent | Richard Kissack | 238 | 8.0 | |
| Independent | John Karran | 123 | 4.1 | |
| Total votes | 2,964 | |||
| Total ballots | 1,688 | |||
| Rejected ballots | 12 | |||
| Turnout | 1,700 | 41.1 | ||
| Registered electors | 4,136 | |||
| Party | Candidate | Votes | ||
|---|---|---|---|---|
| Count | Of total (%) | |||
| Independent | John Houghton | 1,376 | 32.6 | |
| Independent | Bill Henderson | 1,257 | 29.8 | |
| Independent | Theo Fleurbaay | 869 | 20.6 | |
| Liberal Vannin | Peter Hill | 722 | 17.1 | |
| Total votes | 4,224 | |||
| Total ballots | 2,392 | |||
| Rejected ballots | 9 | |||
| Turnout | 2,401 | 50.4 | ||
| Registered electors | 4,761 | |||
| Party | Candidate | Votes | ||
|---|---|---|---|---|
| Count | Of total (%) | |||
| Manx Labour | David Cretney[2] | 1,749 | 44.2 | |
| Liberal Vannin | Kate Beecroft | 1,191 | 30.1 | |
| Independent | Bill Malarkey | 1,019 | 25.7 | |
| Total votes | 3,959 | |||
| Total ballots | 2,402 | |||
| Rejected ballots | 4 | |||
| Turnout | 2,406 | 46.6 | ||
| Registered electors | 5,165 | |||
| Party | Candidate | Votes | ||
|---|---|---|---|---|
| Count | Of total (%) | |||
| Independent | John Shimmin | 1,316 | 33.1 | |
| Independent | Geoff Corkish | 1,017 | 25.6 | |
| Liberal Vannin | Chris Thomas | 913 | 23.0 | |
| Independent | John Skinner | 732 | 18.4 | |
| Total votes | 3,978 | |||
| Total ballots | 2,252 | |||
| Rejected ballots | 4 | |||
| Turnout | 2,256 | 55.8 | ||
| Registered electors | 4,044 | |||
| Party | Candidate | Votes | ||
|---|---|---|---|---|
| Count | Of total (%) | |||
| Independent | Steve Rodan | 1,725 | 92.7 | |
| Liberal Vannin | Nigel Dobson | 136 | 7.3 | |
| Total votes | 1,861 | |||
| Total ballots | 1,861 | |||
| Rejected ballots | 10 | |||
| Turnout | 1,871 | 55.1 | ||
| Registered electors | 3,397 | |||
| Party | Candidate | Votes | ||
|---|---|---|---|---|
| Count | Of total (%) | |||
| Independent | David Anderson | 649 | 46.5 | |
| Independent | Geoffrey Boot | 557 | 39.9 | |
| Independent | Matthew Wadsworth | 189 | 13.5 | |
| Total votes | 1,395 | |||
| Total ballots | 1,395 | |||
| Rejected ballots | 11 | |||
| Turnout | 1,406 | 69.7 | ||
| Registered electors | 2,016 | |||
| Party | Candidate | Votes | ||
|---|---|---|---|---|
| Count | Of total (%) | |||
| Independent | Graham Cregeen | 877 | 71.5 | |
| Independent | Gareth Kelly | 262 | 21.4 | |
| Independent | John Hanson | 87 | 7.1 | |
| Total votes | 1,226 | |||
| Total ballots | 1,226 | |||
| Rejected ballots | 21 | |||
| Turnout | 1,247 | 54 | ||
| Registered electors | 2,309 | |||
| Party | Candidate | Votes | ||
|---|---|---|---|---|
| Count | Of total (%) | |||
| Independent | Alfred Cannan | 1,014 | 64.1 | |
| Independent | David Talbot | 325 | 20.5 | |
| Independent | Paul Heavey | 244 | 15.4 | |
| Total votes | 1,583 | |||
| Total ballots | 1,583 | |||
| Rejected ballots | 7 | |||
| Turnout | 1,590 | 62.6 | ||
| Registered electors | 2,540 | |||
| Party | Candidate | Votes | ||
|---|---|---|---|---|
| Count | Of total (%) | |||
| Independent | Howard Quayle | 922 | 41.9 | |
| Independent | Paul Craine | 560 | 25.5 | |
| Independent | Martyn Quayle | 466 | 21.2 | |
| Liberal Vannin | Juan Cottier | 250 | 11.4 | |
| Total votes | 2,198 | |||
| Total ballots | 2,198 | |||
| Rejected ballots | 8 | |||
| Turnout | 2,206 | 56.1 | ||
| Registered electors | 3,930 | |||
| Party | Candidate | Votes | ||
|---|---|---|---|---|
| Count | Of total (%) | |||
| Liberal Vannin | Peter Karran | 2,704 | 26.8 | |
| Liberal Vannin | Zac Hall | 1,812 | 18.0 | |
| Independent | David Quirk | 1,594 | 15.8 | |
| Independent | Adrian Earnshaw | 1,543 | 15.3 | |
| Independent | June Kelly | 1,339 | 13.3 | |
| Independent | Brian Stowell | 1,093 | 10.8 | |
| Total votes | 10,085 | |||
| Total ballots | 4,016 | |||
| Rejected ballots | 1 | |||
| Turnout | 4,017 | 57.5 | ||
| Registered electors | 6,982 | |||
| Party | Candidate | Votes | ||
|---|---|---|---|---|
| Count | Of total (%) | |||
| Independent | Tim Crookall | 646 | 28.1 | |
| Independent | Leslie Hanson | 615 | 26.7 | |
| Independent | Raymond Harmer | 522 | 22.7 | |
| Independent | Arran Kaighin | 265 | 11.5 | |
| Independent | Rodger Gimbert | 252 | 11.0 | |
| Total votes | 2,300 | |||
| Total ballots | 2,300 | |||
| Rejected ballots | 6 | |||
| Turnout | 2,321 | 58.6 | ||
| Registered electors | 3,693 | |||
| Party | Candidate | Votes | ||
|---|---|---|---|---|
| Count | Of total (%) | |||
| Independent | Allan Bell | 1,988 | 29.7 | |
| Independent | Leonard Singer | 1,911 | 28.5 | |
| Independent | Anne Craine | 1,817 | 27.1 | |
| Liberal Vannin | Linda Bowers-Kasch | 427 | 6.4 | |
| Independent | Lawrie Hooper | 310 | 4.6 | |
| Independent | John McDonough | 243 | 3.6 | |
| Total votes | 6,696 | |||
| Total ballots | 3,737 | |||
| Rejected ballots | 12 | |||
| Turnout | 3,749 | 64.8 | ||
| Registered electors | 5,789 | |||
| Party | Candidate | Votes | ||
|---|---|---|---|---|
| Count | Of total (%) | |||
| Independent | Juan Watterson | 3,080 | 29.6 | |
| Independent | Laurence Skelly | 2,021 | 19.4 | |
| Independent | Phil Gawne | 1,941 | 18.6 | |
| Independent | Quintin Gill | 1,722 | 16.5 | |
| Independent | John Orme | 1,195 | 11.5 | |
| Liberal Vannin | David Jones | 457 | 4.4 | |
| Total votes | 10,416 | |||
| Total ballots | 4,214 | |||
| Rejected ballots | 3 | |||
| Turnout | 4,217 | 60.6 | ||
| Registered electors | 6,960 | |||
References
- "Record voter numbers for Isle of Man General Election". BBC News. 23 September 2011. Retrieved 25 September 2011.
- https://www.youtube.com/watch?v=1mjok8hSwqw
This article is issued from Wikipedia. The text is licensed under Creative Commons - Attribution - Sharealike. Additional terms may apply for the media files.