2011 Ipswich Borough Council election
Elections for Ipswich Borough Council were held on Thursday 5 May 2011. One third of the seats were up for election and the Labour gained control of the council, which had previously been under no overall control.
| |||||||||||||||||||||||||||||||||
16 of the 48 seats 25 seats needed for a majority | |||||||||||||||||||||||||||||||||
|---|---|---|---|---|---|---|---|---|---|---|---|---|---|---|---|---|---|---|---|---|---|---|---|---|---|---|---|---|---|---|---|---|---|
| |||||||||||||||||||||||||||||||||
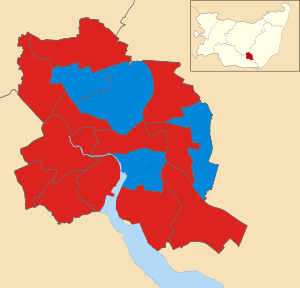 Map showing the 2011 local election results in Ipswich. | |||||||||||||||||||||||||||||||||
| |||||||||||||||||||||||||||||||||
After the election, the composition of the council was:[1]
- Labour 28
- Conservative 16
- Liberal Democrat 4
Ward results
Alexandra
| Party | Candidate | Votes | % | |
|---|---|---|---|---|
| Labour | Harvey Crane | 1,158 | 49.5% | |
| Liberal Democrats | Jane Chambers | 577 | 24.7% | |
| Conservative | Roy Flood | 449 | 19.2% | |
| Green | Jane Scott | 155 | 6.6% | |
| Majority | 581 | 24.8% | ||
| Turnout | 2,339 | |||
| Liberal Democrats hold | ||||
Bixley
| Party | Candidate | Votes | % | |
|---|---|---|---|---|
| Conservative | Kym Stroet | 1,518 | 55.4% | |
| Labour | Kanthasamy Elavalakan | 833 | 30.4% | |
| Liberal Democrats | Clive Witter | 388 | 14.2% | |
| Majority | 685 | 25.0% | ||
| Turnout | 2,739 | |||
| Conservative hold | ||||
Bridge
| Party | Candidate | Votes | % | |
|---|---|---|---|---|
| Labour | Philip Smart | 1,150 | 55.7% | |
| Conservative | James Spencer | 712 | 34.5% | |
| Liberal Democrats | Juliet Groves | 204 | 9.9% | |
| Majority | 438 | 21.2% | ||
| Turnout | 2,066 | |||
| Labour hold | ||||
Castle Hill
| Party | Candidate | Votes | % | |
|---|---|---|---|---|
| Conservative | David Goldsmith | 1,262 | 51.4% | |
| Labour | John Harris | 837 | 34.1% | |
| Liberal Democrats | Robin Whitmore | 180 | 7.3% | |
| Green | Jennifer Overett | 174 | 7.1% | |
| Majority | ||||
| Turnout | ||||
| Conservative hold | ||||
Gainsborough
| Party | Candidate | Votes | % | |
|---|---|---|---|---|
| Labour | Martin Cook | 1,263 | 62.3% | |
| Conservative | Carol Debman | 623 | 30.7% | |
| Liberal Democrats | Jill Atkins | 141 | 7.0% | |
| Majority | 640 | 31.6% | ||
| Turnout | 2,027 | |||
| Labour hold | ||||
Gipping
| Party | Candidate | Votes | % | |
|---|---|---|---|---|
| Labour | Peter Gardiner | 1,204 | 61.0% | |
| Conservative | Maureen Springle | 544 | 27.6% | |
| Liberal Democrats | Stuart McHardy | 226 | 11.4% | |
| Majority | 660 | 33.4% | ||
| Turnout | 1,974 | |||
| Labour hold | ||||
Holywells
| Party | Candidate | Votes | % | |
|---|---|---|---|---|
| Conservative | Liz Harsant | 968 | 44.6% | |
| Labour | Kenneth Douglas | 875 | 40.3% | |
| Liberal Democrats | Rebecca Robinson | 213 | 9.8% | |
| Independent | Dale Jackson | 114 | 5.3% | |
| Majority | 93 | 4.3% | ||
| Turnout | 2,170 | |||
| Conservative hold | ||||
Priory Heath
| Party | Candidate | Votes | % | |
|---|---|---|---|---|
| Labour | William Knowles | 1,290 | 60.3% | |
| Conservative | Oliver Hartley | 605 | 28.3% | |
| Liberal Democrats | Mathew Baker | 244 | 11.4% | |
| Majority | 685 | 32.0% | ||
| Turnout | 2,139 | |||
| Labour hold | ||||
Rushmere
| Party | Candidate | Votes | % | |
|---|---|---|---|---|
| Labour | Tracy Grant | 1,490 | 50.5% | |
| Conservative | Stephen Ion | 1,215 | 41.2% | |
| Liberal Democrats | Gareth Jones | 246 | 8.3% | |
| Majority | 275 | 9.3% | ||
| Turnout | 2,951 | |||
| Labour gain from Conservative | ||||
Sprites
| Party | Candidate | Votes | % | |
|---|---|---|---|---|
| Labour | Roger Fern | 1,202 | 57.0% | |
| Conservative | Robert Hall | 781 | 37.0% | |
| Liberal Democrats | Kenneth Toye | 126 | 6.0% | |
| Majority | 421 | 20.0% | ||
| Turnout | 2,109 | |||
| Labour hold | ||||
St John's
| Party | Candidate | Votes | % | |
|---|---|---|---|---|
| Labour | Neil Macdonald | 1,534 | 56.1% | |
| Conservative | Edward Phillips | 948 | 34.7% | |
| Liberal Democrats | Richard Hardacre | 253 | 9.3% | |
| Majority | 586 | 21.4% | ||
| Turnout | 2,735 | |||
| Labour hold | ||||
St Margaret's
| Party | Candidate | Votes | % | |
|---|---|---|---|---|
| Conservative | Karen Stokes | 1,167 | 37.0% | |
| Liberal Democrats | Kathy French | 1,107 | 35.1% | |
| Labour | Kimberley Cook | 671 | 21.3% | |
| Green | Amy Drayson | 211 | 6.7% | |
| Majority | ||||
| Turnout | ||||
| Conservative gain from Liberal Democrats | ||||
Stoke Park
| Party | Candidate | Votes | % | |
|---|---|---|---|---|
| Labour | Barry Studd | 985 | 47.1% | |
| Conservative | Richard Pope | 876 | 41.9% | |
| Green | Barry Broom | 129 | 6.2% | |
| Liberal Democrats | Kevin Lock | 103 | 4.9% | |
| Majority | 109 | 5.2% | ||
| Turnout | 2,093 | |||
| Labour gain from Conservative | ||||
Westgate
| Party | Candidate | Votes | % | |
|---|---|---|---|---|
| Labour | Julian Gibbs | 972 | 49.4% | |
| Conservative | Lee Reynolds | 435 | 22.1% | |
| Liberal Democrats | Timothy Lockington | 391 | 19.9% | |
| Green | John Mann | 171 | 8.7% | |
| Majority | 537 | 27.3% | ||
| Turnout | 1,969 | |||
| Labour gain from Liberal Democrats | ||||
Whitehouse
| Party | Candidate | Votes | % | |
|---|---|---|---|---|
| Labour | Martin Goonan | 950 | 52.1% | |
| Conservative | Pamela Stewart | 632 | 34.7% | |
| Liberal Democrats | Robert Chambers | 241 | 13.2% | |
| Majority | 318 | 17.4% | ||
| Turnout | 1,823 | |||
| Labour hold | ||||
Whitton
| Party | Candidate | Votes | % | |
|---|---|---|---|---|
| Labour | Stephen Connelly | 1,108 | 50.2% | |
| Conservative | Michelle Bevan-Margetts | 940 | 42.6% | |
| Liberal Democrats | Nicholas Jacob | 158 | 7.2% | |
| Majority | 168 | 7.6% | ||
| Turnout | 2,206 | |||
| Labour hold | ||||
References
- "England council elections". BBC News.
| Suffolk County Council | |
|---|---|
| Babergh District Council | |
| East Suffolk District Council | |
| Ipswich Borough Council | |
| Mid Suffolk District Council | |
| West Suffolk District Council | |
| East Suffolk County Council |
|
| Forest Heath District Council |
|
| St Edmundsbury Borough Council |
|
| Suffolk Coastal District Council | |
| Waveney District Council | |
| West Suffolk County Council |
|
| |
This article is issued from Wikipedia. The text is licensed under Creative Commons - Attribution - Sharealike. Additional terms may apply for the media files.