2001 United Kingdom general election in Scotland
These are the results of the 2001 United Kingdom general election (Scotland). The election was held on Thursday, 7 June 2001 and all 72 seats in Scotland were contested. There was only one Scottish seat which changed parties during the election; that of Galloway and Upper Nithsdale which Peter Duncan of the Conservative Party gained from Alisdair Morgan of the SNP, by just 74 votes. Apart from the Conservatives increasing their representation to a single seat, the election was essentially a repeat of the previous result four years earlier; with Labour still the largest party in terms of seats won.
| |||||||||||||||||||||||||||||||||||||||||||||||||||||||||||||||||
All 72 Scottish seats to the House of Commons | |||||||||||||||||||||||||||||||||||||||||||||||||||||||||||||||||
|---|---|---|---|---|---|---|---|---|---|---|---|---|---|---|---|---|---|---|---|---|---|---|---|---|---|---|---|---|---|---|---|---|---|---|---|---|---|---|---|---|---|---|---|---|---|---|---|---|---|---|---|---|---|---|---|---|---|---|---|---|---|---|---|---|---|
| Turnout | 58.2%, | ||||||||||||||||||||||||||||||||||||||||||||||||||||||||||||||||
| |||||||||||||||||||||||||||||||||||||||||||||||||||||||||||||||||
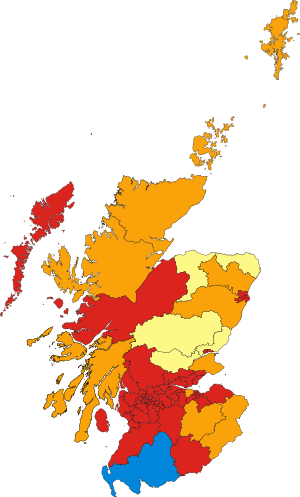 Results of the 2001 election in Scotland | |||||||||||||||||||||||||||||||||||||||||||||||||||||||||||||||||
.jpg)
.jpg)
.jpg)
Results
Below is a table summarising the results of the 2001 general election in Scotland.[1]
| Party | Seats | Seats change |
Votes | % | % change | |
|---|---|---|---|---|---|---|
| Labour | 56 | 0 | 1,017,226 | 43.9 | -1.7 | |
| SNP | 5 | -1 | 464,314 | 20.1 | -2.0 | |
| Liberal Democrats | 10 | 0 | 380,034 | 16.4 | +3.4 | |
| Conservative | 1 | +1 | 360,658 | 15.6 | -1.9 | |
| Scottish Socialist | 0 | 0 | 72,518 | 3.1 | ||
| Scottish Green | 0 | 0 | 4,551 | 0.2 | +0.1 | |
| UKIP | 0 | 0 | 3,236 | 0.1 | 0.0 | |
| Socialist Labour | 0 | 0 | 3,184 | 0.1 | 0.0 | |
| Scottish Unionist | 0 | 0 | 2,728 | 0.1 | ||
| Legalise Cannabis | 0 | 0 | 955 | 0.0 | ||
| ProLife Alliance | 0 | 0 | 786 | 0.0 | -0.2 | |
| Monster Raving Loony | 0 | 0 | 405 | 0.0 | ||
| Liberal | 0 | 0 | 383 | 0.0 | 0.0 | |
| Countryside Party | 0 | 0 | 265 | 0.0 | ||
| Scottish Freedom Referendum Party | 0 | 0 | 250 | 0.0 | ||
| Rock 'n' Roll Loony | 0 | 0 | 211 | 0.0 | ||
| Communist | 0 | 0 | 174 | 0.0 | ||
| Independent | 0 | 0 | 3,825 | 0.2 | ||
| Turnout | 2,315,703 | 58.2 | -13.1 | |||
Votes summary
References
- "Election 2001 | Results | Scotland". BBC News. 14 August 2001. Retrieved 3 November 2011.
| Scottish Parliament | |
|---|---|
| Parliament of Scotland |
|
| Convention of Estates |
|
| UK Parliament |
|
| Local elections | |
| Referendums | |
This article is issued from Wikipedia. The text is licensed under Creative Commons - Attribution - Sharealike. Additional terms may apply for the media files.