2000–01 Football League
The 2000–01 Football League (known as the Nationwide Football League for sponsorship reasons) was the 102nd completed season of The Football League.
| Season | 2000–01 |
|---|---|
| Champions | Fulham |
| Promoted | Fulham Blackburn Rovers Bolton Wanderers |
| Relegated | Barnet |
| New Club in League | Kidderminster Harriers |
2001–02 → | |
First Division
| Season | 2000–01 |
|---|---|
| Champions | Fulham (2nd second tier title) |
| Direct promotion to FA Premier League | Fulham, Blackburn Rovers |
| Promoted to FA Premier League through play-offs | Bolton Wanderers |
| Relegated | Huddersfield Town, Queens Park Rangers, Tranmere Rovers |
| Matches played | 552 |
| Goals scored | 1,373 (2.49 per match) |
| Top goalscorer | Louis Saha (Fulham), 27 [1] |
2001–02 → | |
Team changes
The following teams changed division since the 1999–2000 season.
From First Division
Promoted to FA Premier League
Relegated to Second Division
To First Division
Promoted from Second Division
Relegated from FA Premier League
| Pos | Team | Pld | HW | HD | HL | HGF | HGA | AW | AD | AL | AGF | AGA | GD | Pts | Promotion or relegation |
|---|---|---|---|---|---|---|---|---|---|---|---|---|---|---|---|
| 1 | Fulham | 46 | 16 | 5 | 2 | 49 | 14 | 14 | 6 | 3 | 41 | 18 | +58 | 101 | Football League Champions, promoted to FA Premier League |
| 2 | Blackburn Rovers | 46 | 15 | 5 | 3 | 43 | 20 | 11 | 8 | 4 | 33 | 19 | +37 | 91 | Promoted to Premier League |
| 3 | Bolton Wanderers | 46 | 10 | 10 | 3 | 40 | 28 | 14 | 5 | 4 | 36 | 17 | +31 | 87 | Promoted to Premier League through play-offs |
| 4 | Preston North End | 46 | 12 | 6 | 5 | 32 | 18 | 11 | 3 | 9 | 32 | 34 | +12 | 78 | Participated in play-offs |
| 5 | Birmingham City | 46 | 14 | 3 | 6 | 34 | 22 | 9 | 6 | 8 | 25 | 26 | +11 | 78 | |
| 6 | West Bromwich Albion | 46 | 13 | 5 | 5 | 37 | 23 | 8 | 6 | 9 | 23 | 29 | +8 | 74 | |
| 7 | Burnley | 46 | 14 | 5 | 4 | 30 | 17 | 7 | 4 | 12 | 20 | 37 | −4 | 72 | |
| 8 | Wimbledon | 46 | 7 | 11 | 5 | 33 | 26 | 10 | 7 | 6 | 38 | 24 | +21 | 69 | |
| 9 | Watford | 46 | 11 | 6 | 6 | 46 | 29 | 9 | 3 | 11 | 30 | 38 | +9 | 69 | |
| 10 | Sheffield United | 46 | 14 | 4 | 5 | 34 | 18 | 5 | 7 | 11 | 18 | 31 | +3 | 68 | |
| 11 | Nottingham Forest | 46 | 11 | 3 | 9 | 28 | 24 | 9 | 5 | 9 | 27 | 29 | +2 | 68 | |
| 12 | Wolverhampton Wanderers | 46 | 7 | 9 | 7 | 25 | 20 | 7 | 4 | 12 | 20 | 28 | −3 | 55 | |
| 13 | Gillingham | 46 | 9 | 6 | 8 | 32 | 28 | 4 | 10 | 9 | 29 | 38 | −5 | 55 | |
| 14 | Crewe Alexandra | 46 | 12 | 5 | 6 | 30 | 24 | 3 | 5 | 15 | 17 | 38 | −15 | 55 | |
| 15 | Norwich City | 46 | 10 | 7 | 6 | 25 | 18 | 4 | 5 | 14 | 21 | 40 | −12 | 54 | |
| 16 | Barnsley | 46 | 11 | 3 | 9 | 32 | 26 | 4 | 6 | 13 | 17 | 36 | −13 | 54 | |
| 17 | Sheffield Wednesday | 46 | 9 | 4 | 10 | 34 | 38 | 6 | 4 | 13 | 18 | 33 | −19 | 53 | |
| 18 | Grimsby Town | 46 | 10 | 4 | 9 | 26 | 27 | 4 | 6 | 13 | 17 | 35 | −19 | 52 | |
| 19 | Stockport County | 46 | 6 | 11 | 6 | 29 | 26 | 5 | 7 | 11 | 29 | 39 | −7 | 51 | |
| 20 | Portsmouth | 46 | 9 | 8 | 6 | 31 | 25 | 1 | 11 | 11 | 16 | 34 | −12 | 49 | |
| 21 | Crystal Palace | 46 | 6 | 6 | 11 | 28 | 34 | 6 | 7 | 10 | 29 | 36 | −13 | 49 | |
| 22 | Huddersfield Town | 46 | 7 | 6 | 10 | 29 | 26 | 4 | 9 | 10 | 19 | 31 | −9 | 48 | Relegated |
| 23 | Queens Park Rangers | 46 | 6 | 9 | 8 | 24 | 28 | 1 | 10 | 12 | 21 | 47 | −30 | 40 | |
| 24 | Tranmere Rovers | 46 | 8 | 7 | 8 | 30 | 33 | 1 | 4 | 18 | 16 | 44 | −31 | 38 |
Source:
Play-offs
- Source:[2]
| Semifinals 1st leg –May 13th; 2nd leg –May 17th, 2001 |
Final at Millennium Stadium, Cardiff May 28th, 2001 | |||||||||
| 3rd | Bolton Wanderers | 2 | 3 | 5 | ||||||
| 6th | West Bromwich Albion | 2 | 0 | 2 | ||||||
| 3rd | Bolton Wanderers | 3 | ||||||||
| 4th | Preston North End | 0 | ||||||||
| 4th | Preston North End (pen.) | 0 | 2 | 2 (4) | ||||||
| 5th | Birmingham City | 1 | 1 | 2 (2) | ||||||
Results
Top scorers
| Rank | Player | Club | Goals |
|---|---|---|---|
| 1 | Fulham | 27 | |
| 2 | Blackburn Rovers | 23 | |
| 3 | West Bromwich Albion | 21 | |
| 4 | Wimbledon | 19 | |
| = | Preston North End | 19 | |
| = | Bolton Wanderers | 19 | |
| 5 | Fulham | 18 | |
| = | Fulham | 18 |
Maps
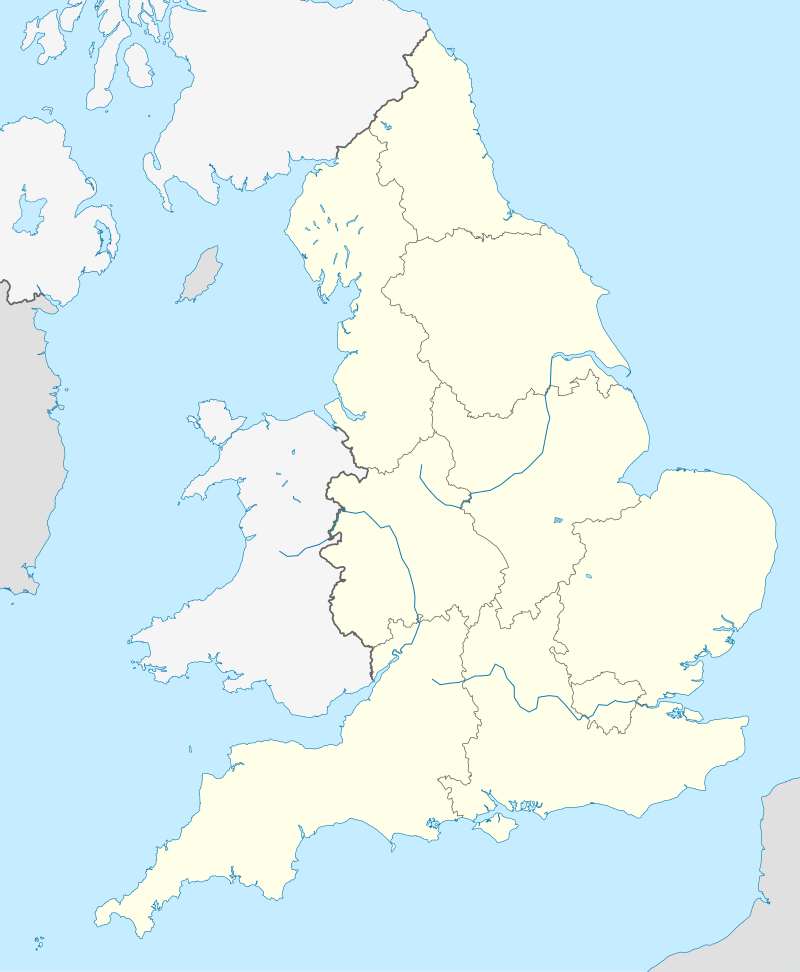
Locations of the Football League First Division 2000–2001 teams
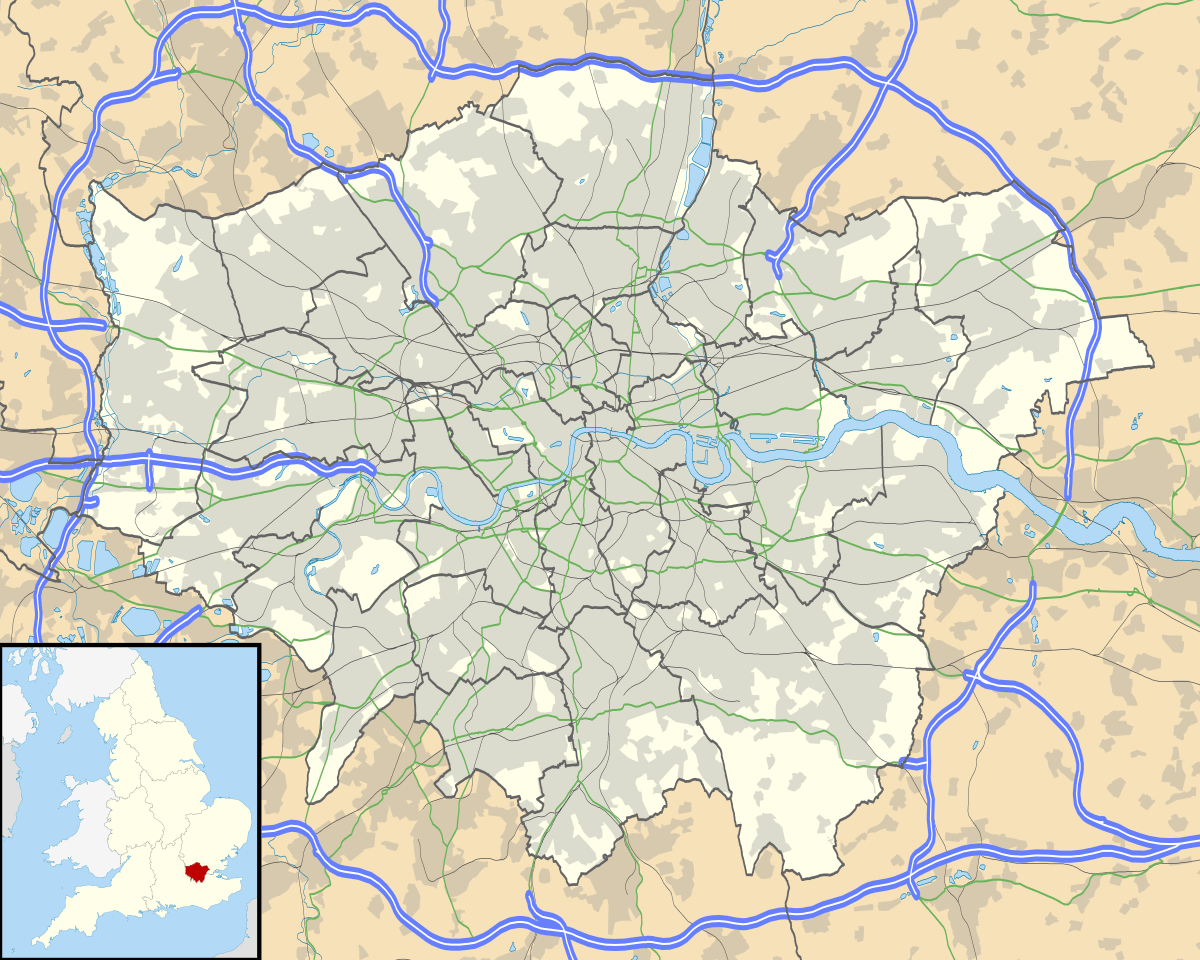
Locations of the Football League First Division London teams 2000–2001
Second Division
| Season | 2000–01 |
|---|---|
| Champions | Millwall (1st third tier title) |
| Direct promotion | Millwall, Rotherham United |
| Promoted through play-offs | Walsall |
| Relegated | Bristol Rovers, Luton Town, Oxford United, Swansea City |
| Matches played | 552 |
| Goals scored | 1,466 (2.66 per match) |
| Top goalscorer | Neil Harris (Millwall), 27 [1] |
2001–02 → | |
Team changes
The following teams changed division since the 1999–2000 season.
From Second Division
Promoted to First Division
Relegated to Third Division
To Second Division
Promoted from Third Division
Relegated from First Division
| Pos | Team | Pld | HW | HD | HL | HGF | HGA | AW | AD | AL | AGF | AGA | GD | Pts | Promotion or relegation |
|---|---|---|---|---|---|---|---|---|---|---|---|---|---|---|---|
| 1 | Millwall | 46 | 17 | 2 | 4 | 49 | 11 | 11 | 7 | 5 | 40 | 27 | +51 | 93 | Division Champions, promoted |
| 2 | Rotherham United | 46 | 16 | 4 | 3 | 50 | 26 | 11 | 6 | 6 | 29 | 29 | +24 | 91 | Promoted |
| 3 | Reading | 46 | 15 | 5 | 3 | 58 | 26 | 10 | 6 | 7 | 28 | 26 | +34 | 86 | Participated in play-offs |
| 4 | Walsall | 46 | 15 | 5 | 3 | 51 | 23 | 8 | 7 | 8 | 28 | 27 | +29 | 81 | Promoted through play-offs |
| 5 | Stoke City | 46 | 12 | 6 | 5 | 39 | 21 | 9 | 8 | 6 | 35 | 28 | +25 | 77 | Participated in play-offs |
| 6 | Wigan Athletic | 46 | 12 | 9 | 2 | 29 | 18 | 7 | 9 | 7 | 24 | 24 | +11 | 75 | |
| 7 | Bournemouth | 46 | 11 | 6 | 6 | 37 | 23 | 9 | 7 | 7 | 42 | 32 | +24 | 73 | |
| 8 | Notts County | 46 | 10 | 6 | 7 | 37 | 33 | 9 | 6 | 8 | 25 | 33 | −4 | 69 | |
| 9 | Bristol City | 46 | 11 | 6 | 6 | 47 | 29 | 7 | 8 | 8 | 23 | 27 | +14 | 68 | |
| 10 | Wrexham | 46 | 10 | 6 | 7 | 33 | 28 | 7 | 6 | 10 | 32 | 43 | −6 | 63 | |
| 11 | Port Vale | 46 | 9 | 8 | 6 | 35 | 22 | 7 | 6 | 10 | 20 | 27 | +6 | 62 | |
| 12 | Peterborough United | 46 | 12 | 6 | 5 | 38 | 27 | 3 | 8 | 12 | 23 | 39 | −5 | 59 | |
| 13 | Wycombe Wanderers | 46 | 8 | 7 | 8 | 24 | 23 | 7 | 7 | 9 | 22 | 30 | −7 | 59 | |
| 14 | Brentford | 46 | 9 | 10 | 4 | 34 | 30 | 5 | 7 | 11 | 22 | 40 | −14 | 59 | |
| 15 | Oldham Athletic | 46 | 11 | 5 | 7 | 35 | 26 | 4 | 8 | 11 | 18 | 39 | −12 | 58 | |
| 16 | Bury | 46 | 10 | 6 | 7 | 25 | 22 | 6 | 4 | 13 | 20 | 37 | −14 | 58 | |
| 17 | Colchester United | 46 | 10 | 5 | 8 | 32 | 23 | 5 | 7 | 11 | 23 | 36 | −4 | 57 | |
| 18 | Northampton Town | 46 | 9 | 6 | 8 | 26 | 28 | 6 | 6 | 11 | 20 | 31 | −13 | 57 | |
| 19 | Cambridge United | 46 | 8 | 6 | 9 | 32 | 31 | 6 | 5 | 12 | 29 | 46 | −16 | 53 | |
| 20 | Swindon Town | 46 | 6 | 8 | 9 | 30 | 35 | 7 | 5 | 11 | 17 | 30 | −18 | 52 | |
| 21 | Bristol Rovers | 46 | 6 | 10 | 7 | 28 | 26 | 6 | 5 | 12 | 25 | 31 | −4 | 51 | Relegated |
| 22 | Luton Town | 46 | 5 | 6 | 12 | 24 | 35 | 4 | 7 | 12 | 28 | 45 | −28 | 40 | |
| 23 | Swansea City | 46 | 5 | 9 | 9 | 26 | 24 | 3 | 4 | 16 | 21 | 49 | −26 | 37 | |
| 24 | Oxford United | 46 | 5 | 4 | 14 | 23 | 34 | 2 | 2 | 19 | 30 | 66 | −47 | 27 |
Source:
Rules for classification: In the Football League goals scored (GF) takes precedence over goal difference (GD).
Rules for classification: In the Football League goals scored (GF) takes precedence over goal difference (GD).
Play-offs
- Source:[2]
| Semifinals 1st leg –May 13th; 2nd leg –May 16th, 2001 |
Final at Millennium Stadium, Cardiff May 27th, 2001 | |||||||||
| 3rd | Reading | 0 | 2 | 2 | ||||||
| 6th | Wigan Athletic | 0 | 1 | 1 | ||||||
| 3rd | Reading | 2 | ||||||||
| 4th | Walsall (a.e.t.) | 3 | ||||||||
| 4th | Walsall | 0 | 4 | 4 | ||||||
| 5th | Stoke City | 0 | 2 | 2 | ||||||
Maps
Locations of the Football League Second Division 2000–2001 teams
Third Division
| Season | 2000–01 |
|---|---|
| Champions | Brighton & Hove Albion (2nd fourth tier title) |
| Direct promotion | Brighton & Hove Albion, Cardiff City, Chesterfield |
| Promoted through play-offs | Blackpool |
| Relegated to Conference | Barnet |
| New club in the league | Kidderminster Harriers |
| Matches played | 552 |
| Goals scored | 1,397 (2.53 per match) |
| Top goalscorer | Bobby Zamora (Brighton & Hove Albion), 28 [1] |
2001–02 → | |
Team changes
The following teams changed division since the 1999–2000 season.
From Third Division
Promoted to Second Division
Relegated to Football Conference
To Third Division
Promoted from Football Conference
Relegated from Second Division
| Pos | Team | Pld | HW | HD | HL | HGF | HGA | AW | AD | AL | AGF | AGA | GD | Pts | Promotion or relegation |
|---|---|---|---|---|---|---|---|---|---|---|---|---|---|---|---|
| 1 | Brighton & Hove Albion | 46 | 19 | 2 | 2 | 52 | 14 | 9 | 6 | 8 | 21 | 21 | +38 | 92 | Division Champions, promoted |
| 2 | Cardiff City | 46 | 16 | 7 | 0 | 56 | 20 | 7 | 6 | 10 | 39 | 38 | +37 | 82 | Promoted |
| 3 | Chesterfield | 46 | 16 | 5 | 2 | 46 | 14 | 9 | 9 | 5 | 33 | 28 | +37 | 80[lower-alpha 1] | |
| 4 | Hartlepool United | 46 | 12 | 8 | 3 | 40 | 23 | 9 | 6 | 8 | 31 | 31 | +17 | 77 | Participated in play-offs |
| 5 | Leyton Orient | 46 | 13 | 7 | 3 | 31 | 18 | 7 | 8 | 8 | 28 | 33 | +8 | 75 | |
| 6 | Hull City | 46 | 12 | 7 | 4 | 27 | 18 | 7 | 10 | 6 | 20 | 21 | +8 | 74 | |
| 7 | Blackpool | 46 | 14 | 4 | 5 | 50 | 26 | 8 | 2 | 13 | 24 | 32 | +16 | 72 | Promoted through play-offs |
| 8 | Rochdale | 46 | 11 | 8 | 4 | 36 | 25 | 7 | 9 | 7 | 23 | 23 | +11 | 71 | |
| 9 | Cheltenham Town | 46 | 12 | 5 | 6 | 37 | 27 | 6 | 9 | 8 | 22 | 25 | +7 | 68 | |
| 10 | Scunthorpe United | 46 | 13 | 7 | 3 | 42 | 16 | 5 | 4 | 14 | 20 | 36 | +10 | 65 | |
| 11 | Southend United | 46 | 10 | 8 | 5 | 29 | 23 | 5 | 10 | 8 | 26 | 30 | +2 | 63 | |
| 12 | Plymouth Argyle | 46 | 13 | 5 | 5 | 33 | 17 | 2 | 8 | 13 | 21 | 44 | −7 | 58 | |
| 13 | Mansfield Town | 46 | 12 | 7 | 4 | 40 | 26 | 3 | 6 | 14 | 24 | 46 | −8 | 58 | |
| 14 | Macclesfield Town | 46 | 10 | 5 | 8 | 23 | 21 | 4 | 9 | 10 | 28 | 41 | −11 | 56 | |
| 15 | Shrewsbury Town | 46 | 12 | 5 | 6 | 30 | 26 | 3 | 5 | 15 | 19 | 39 | −16 | 55 | |
| 16 | Kidderminster Harriers[lower-alpha 2] | 46 | 10 | 6 | 7 | 29 | 27 | 3 | 8 | 12 | 18 | 34 | −14 | 53 | |
| 17 | York City | 46 | 9 | 6 | 8 | 23 | 26 | 4 | 7 | 12 | 19 | 37 | −21 | 52 | |
| 18 | Lincoln City | 46 | 9 | 9 | 5 | 36 | 28 | 3 | 6 | 14 | 22 | 38 | −8 | 51 | |
| 19 | Exeter City | 46 | 8 | 9 | 6 | 22 | 20 | 4 | 5 | 14 | 18 | 38 | −18 | 50 | |
| 20 | Darlington | 46 | 10 | 6 | 7 | 28 | 23 | 2 | 7 | 14 | 16 | 33 | −12 | 49 | |
| 21 | Torquay United | 46 | 8 | 9 | 6 | 30 | 29 | 4 | 4 | 15 | 22 | 48 | −25 | 49 | |
| 22 | Carlisle United | 46 | 8 | 8 | 7 | 26 | 26 | 3 | 7 | 13 | 16 | 39 | −23 | 48 | |
| 23 | Halifax Town | 46 | 7 | 6 | 10 | 33 | 32 | 5 | 5 | 13 | 21 | 36 | −14 | 47 | |
| 24 | Barnet | 46 | 9 | 8 | 6 | 44 | 29 | 3 | 1 | 19 | 23 | 52 | −14 | 45 | Relegated to Conference |
Source: [2]
Rules for classification: In the Football League goals scored (GF) takes precedence over goal difference (GD).
Notes:
Rules for classification: In the Football League goals scored (GF) takes precedence over goal difference (GD).
Notes:
- Chesterfield had 9 points deducted.
- New club in the league
Play-offs
- Source:[2]
| Semifinals 1st leg –May 13th; 2nd leg –May 16th, 2001 |
Final at Wembley Stadium May 26th, 2001 | |||||||||
| 4th | Hartlepool United | 0 | 1 | 1 | ||||||
| 7th | Blackpool | 2 | 3 | 5 | ||||||
| 5th | Leyton Orient | 2 | ||||||||
| 7th | Blackpool | 4 | ||||||||
| 5th | Leyton Orient | 0 | 2 | 2 | ||||||
| 6th | Hull City | 1 | 0 | 1 | ||||||
Maps
Kidderminster Harriers
Locations of the Football League Third Division teams 2000–2001
Locations of the Football League Third Division London teams 2000–2001
References
- "English League Leading Goalscorers". RSSSF. Retrieved 2010-10-31.
- "England 2000–01". Rec.Sport.Soccer Statistics Foundation. Archived from the original on 26 January 2010. Retrieved 2010-02-24.
This article is issued from Wikipedia. The text is licensed under Creative Commons - Attribution - Sharealike. Additional terms may apply for the media files.