1999 St Albans City and District Council election
The 1999 St Albans City and District Council election took place on 6 May 1999 to elect members of St Albans City and District Council in Hertfordshire, England. The whole council was up for election with boundary changes since the last election in 1998 increasing the number of seats by 1.[1] The Liberal Democrats lost overall control of the council to no overall control.[2]
Election result
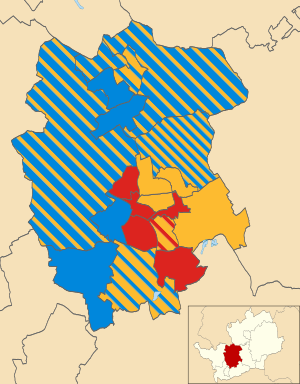
Both the Liberal Democrats and Conservatives won 21 seats, while Labour took 16 seats.[3] Boundary changes had increased the number of seats to 58 from 57, with an exact seat in Sandridge ward.[3] The closest result was in Harpenden East, where Conservative Michael Clark won a seat by 3 votes defeating the mayor Brian Peyton.[3] Overall turnout at the election was 37.1%, up from 35.3% at the 1998 election but down from the 39.6% in 1996.[3]
| Party | Seats | Gains | Losses | Net gain/loss | Seats % | Votes % | Votes | +/− | |
|---|---|---|---|---|---|---|---|---|---|
| Liberal Democrats | 21 | -9 | 36.2 | 34.8 | 36,609 | -1.1% | |||
| Conservative | 21 | +10 | 36.2 | 34.5 | 36,217 | +1.2% | |||
| Labour | 16 | 0 | 27.6 | 30.5 | 32,101 | -0.3% | |||
| Independent | 0 | 0 | 0 | 0.2 | 178 | +0.2% | |||
Ward results
| Party | Candidate | Votes | % | ± | |
|---|---|---|---|---|---|
| Labour | Alistair Cooper | 1,007 | |||
| Labour | Malachy Pakenham | 946 | |||
| Labour | Edward Hill | 944 | |||
| Liberal Democrats | Francesca Day | 444 | |||
| Liberal Democrats | Dawn Devereux | 442 | |||
| Liberal Democrats | David Parry | 378 | |||
| Conservative | James Black | 319 | |||
| Conservative | Peter White | 287 | |||
| Conservative | Philip Oxley | 284 | |||
| Turnout | 5,051 | 44.7 | |||
| Party | Candidate | Votes | % | ± | |
|---|---|---|---|---|---|
| Labour | David McManus | 1,063 | |||
| Labour | Roma Mills | 1,045 | |||
| Labour | Andrew Rose | 990 | |||
| Liberal Democrats | Richard Biddle | 283 | |||
| Conservative | Edward Ellis | 269 | |||
| Conservative | Pamela Farley | 265 | |||
| Liberal Democrats | Robin Law | 257 | |||
| Conservative | Margaret Winterhoff | 250 | |||
| Liberal Democrats | Robert Latham | 242 | |||
| Turnout | 4,664 | 32.8 | |||
| Party | Candidate | Votes | % | ± | |
|---|---|---|---|---|---|
| Liberal Democrats | Sheila Burton | 1,089 | |||
| Liberal Democrats | Joyce Lusby | 1,018 | |||
| Liberal Democrats | John Wright | 1,006 | |||
| Labour | Nigel Culkin | 619 | |||
| Labour | Helen Hutchinson | 605 | |||
| Labour | Clive Newport | 581 | |||
| Conservative | Jeremy Christie | 356 | |||
| Conservative | Nigel Woodsmith | 350 | |||
| Conservative | James Vessey | 340 | |||
| Turnout | 5,964 | ||||
| Party | Candidate | Votes | % | ± | |
|---|---|---|---|---|---|
| Liberal Democrats | Susan Defoe | 532 | |||
| Liberal Democrats | John Henchley | 531 | |||
| Conservative | Julia Jeffrey | 288 | |||
| Labour | Gordon Watson | 288 | |||
| Conservative | Derek Jeffrey | 282 | |||
| Labour | Michael Gibson | 268 | |||
| Turnout | 2,189 | 33.7 | |||
| Party | Candidate | Votes | % | ± | |
|---|---|---|---|---|---|
| Liberal Democrats | Robert Donald | 1,007 | |||
| Liberal Democrats | Edward Roberts | 882 | |||
| Labour | Andrew Gilson | 877 | |||
| Liberal Democrats | Geoffrey Harrison | 848 | |||
| Labour | Laurence Heyman | 846 | |||
| Labour | David Allan | 839 | |||
| Conservative | Diana Hall | 354 | |||
| Conservative | Graham Leonard | 323 | |||
| Conservative | Louisa-Jane Rosalki | 299 | |||
| Turnout | 6,275 | 45.0 | |||
| Party | Candidate | Votes | % | ± | |
|---|---|---|---|---|---|
| Liberal Democrats | David Waddilove | 862 | |||
| Liberal Democrats | Alison Steer | 834 | |||
| Conservative | Michael Clark | 799 | |||
| Liberal Democrats | Brian Peyton | 796 | |||
| Conservative | John Cozens | 741 | |||
| Conservative | Victor Holley | 735 | |||
| Labour | David Crew | 470 | |||
| Labour | Rosemary Ross | 417 | |||
| Labour | Elizabeth McShane | 398 | |||
| Turnout | 6,052 | 38.1 | |||
| Party | Candidate | Votes | % | ± | |
|---|---|---|---|---|---|
| Conservative | Albert Pawle | 820 | |||
| Liberal Democrats | John Coad | 814 | |||
| Conservative | David Coe | 787 | |||
| Conservative | Maurice Purkiss | 776 | |||
| Liberal Democrats | Terence Glenister | 726 | |||
| Liberal Democrats | Valerie Goodyear | 702 | |||
| Labour | David Dunmore | 236 | |||
| Labour | Gavin Ross | 235 | |||
| Labour | Richard Botterill | 232 | |||
| Turnout | 5,328 | 34.9 | |||
| Party | Candidate | Votes | % | ± | |
|---|---|---|---|---|---|
| Conservative | Paul Foster | 1,113 | |||
| Conservative | Patrick Johnston | 1,093 | |||
| Conservative | Michael Morrell | 1,081 | |||
| Liberal Democrats | Katharine Sutton | 456 | |||
| Liberal Democrats | Christopher Canfield | 441 | |||
| Liberal Democrats | Paul De Kort | 389 | |||
| Labour | Julie Lightfoot | 353 | |||
| Labour | Enid Bright | 334 | |||
| Labour | Melvin Cato | 323 | |||
| Turnout | 5,583 | 36.2 | |||
| Party | Candidate | Votes | % | ± | |
|---|---|---|---|---|---|
| Conservative | Julian Daly | 1,189 | |||
| Conservative | John Newman | 1,170 | |||
| Conservative | Julian Turner | 1,170 | |||
| Liberal Democrats | Mary Skinner | 430 | |||
| Liberal Democrats | George Gostling | 411 | |||
| Liberal Democrats | Paul Spinks | 410 | |||
| Labour | Ruth Gordon-Weeks | 316 | |||
| Labour | Elizabeth Rayner | 295 | |||
| Labour | David Lawlor | 288 | |||
| Turnout | 5,679 | 34.0 | |||
| Party | Candidate | Votes | % | ± | |
|---|---|---|---|---|---|
| Labour | Malcolm MacMillan | 1,064 | |||
| Labour | Etheldreda Gordon | 1,047 | |||
| Labour | Sean Flynn | 1,026 | |||
| Conservative | Avril Foster | 293 | |||
| Conservative | Derek Caroline | 277 | |||
| Conservative | Carol Howard | 277 | |||
| Liberal Democrats | Sarah Piercy | 159 | |||
| Liberal Democrats | David Priestman | 149 | |||
| Liberal Democrats | Moira Seton | 124 | |||
| Turnout | 4,416 | 26.4 | |||
| Party | Candidate | Votes | % | ± | |
|---|---|---|---|---|---|
| Liberal Democrats | Geoffrey Churchard | 910 | |||
| Liberal Democrats | Thomas Clegg | 826 | |||
| Liberal Democrats | Jennifer Stroud | 803 | |||
| Conservative | Frances Leonard | 716 | |||
| Conservative | John Foster | 698 | |||
| Conservative | Michael Bretherton | 676 | |||
| Labour | John Baughan | 398 | |||
| Labour | Flora Falconer | 378 | |||
| Labour | Lynda Harris | 371 | |||
| Turnout | 5,776 | 39.8 | |||
| Party | Candidate | Votes | % | ± | |
|---|---|---|---|---|---|
| Liberal Democrats | Anthony Rowland | 1,088 | |||
| Liberal Democrats | John Peters | 946 | |||
| Liberal Democrats | Joy Winder | 865 | |||
| Conservative | Brian Doble | 700 | |||
| Conservative | Agnes Hill | 697 | |||
| Conservative | Philip Webster | 682 | |||
| Labour | Eleanor Harris | 518 | |||
| Labour | Jane Cloke | 486 | |||
| Labour | Janet Smith | 463 | |||
| Turnout | 6,445 | 42.2 | |||
| Party | Candidate | Votes | % | ± | |
|---|---|---|---|---|---|
| Liberal Democrats | Richard Downs | 702 | |||
| Liberal Democrats | Barry Blackwell | 671 | |||
| Conservative | Thomas Burns | 668 | |||
| Conservative | Michael Pugh | 660 | |||
| Conservative | Nigel Cocks | 659 | |||
| Liberal Democrats | Syed Abidi | 646 | |||
| Labour | Mary Morley | 418 | |||
| Labour | David Davies | 378 | |||
| Labour | Ronald Wilson | 357 | |||
| Turnout | 5,159 | 32.7 | |||
| Party | Candidate | Votes | % | ± | |
|---|---|---|---|---|---|
| Conservative | Margaret Corley | 851 | |||
| Liberal Democrats | Patricia Schofield | 818 | |||
| Conservative | Brian Chapman | 797 | |||
| Conservative | Paul Finigan | 696 | |||
| Liberal Democrats | John Schofield | 675 | |||
| Liberal Democrats | Eric Humbles | 630 | |||
| Labour | Colin Hucklesby | 336 | |||
| Labour | Vivienne Windle | 305 | |||
| Labour | John Paton | 253 | |||
| Turnout | 5,361 | 41.4 | |||
| Party | Candidate | Votes | % | ± | |
|---|---|---|---|---|---|
| Conservative | Christopher Whiteside | 637 | |||
| Liberal Democrats | William Morris | 564 | |||
| Conservative | Beric Read | 529 | |||
| Liberal Democrats | Laurence Brown | 449 | |||
| Labour | Christine Dawson | 260 | |||
| Labour | John Tomblin | 249 | |||
| Independent | Basil Filmer | 178 | |||
| Turnout | 2,866 | 39.7 | |||
| Party | Candidate | Votes | % | ± | |
|---|---|---|---|---|---|
| Labour | Janetta Gibbs | 1,043 | |||
| Labour | David Enright | 1,034 | |||
| Labour | Mark Wilson | 1,016 | |||
| Conservative | Eileen Brown | 287 | |||
| Conservative | Janet Cameron | 276 | |||
| Conservative | Margaret Brownlie | 274 | |||
| Liberal Democrats | Peter Harris | 192 | |||
| Liberal Democrats | John Hale | 178 | |||
| Liberal Democrats | David Terrar | 157 | |||
| Turnout | 4,457 | 28.9 | |||
| Party | Candidate | Votes | % | ± | |
|---|---|---|---|---|---|
| Labour | Lynette Warren | 973 | |||
| Labour | Winifred Dunleavy | 955 | |||
| Labour | Helen Ives-Rose | 912 | |||
| Liberal Democrats | John Gunner | 544 | |||
| Liberal Democrats | Alisdair Gould | 528 | |||
| Liberal Democrats | Michael Saunders | 491 | |||
| Conservative | Geoffrey Brown | 272 | |||
| Conservative | Sheila Sanders | 264 | |||
| Conservative | Mark Shaw | 227 | |||
| Turnout | 5,166 | 34.4 | |||
| Party | Candidate | Votes | % | ± | |
|---|---|---|---|---|---|
| Conservative | Gordon Myland | 904 | |||
| Conservative | Susan Carr | 836 | |||
| Conservative | Hazel Ward | 826 | |||
| Liberal Democrats | Kahlil Moghul | 740 | |||
| Liberal Democrats | Jadwiga Baillie | 708 | |||
| Liberal Democrats | Gerald Kaye | 647 | |||
| Labour | Patricia Allen | 314 | |||
| Labour | Janet Blackwell | 306 | |||
| Labour | Anthony Allen | 282 | |||
| Turnout | 5,563 | 38.2 | |||
| Party | Candidate | Votes | % | ± | |
|---|---|---|---|---|---|
| Conservative | John Smith | 1,124 | |||
| Conservative | Richard Blossom | 1,030 | |||
| Conservative | Clare Ellis | 991 | |||
| Liberal Democrats | Martin Frearson | 930 | |||
| Liberal Democrats | Kathleen Morris | 885 | |||
| Liberal Democrats | Susan Campbell | 859 | |||
| Labour | Karl Bruckdorfer | 434 | |||
| Labour | Jilliam Butchart | 432 | |||
| Labour | Constance Vuolo | 406 | |||
| Turnout | 7,091 | 45.8 | |||
| Party | Candidate | Votes | % | ± | |
|---|---|---|---|---|---|
| Liberal Democrats | Christopher Oxley | 964 | |||
| Conservative | Keith Stammers | 963 | |||
| Conservative | Gillian Clark | 888 | |||
| Liberal Democrats | Neil Page | 804 | |||
| Conservative | Derek Hills | 802 | |||
| Liberal Democrats | Paul Edelston | 727 | |||
| Labour | Peter Woodhams | 310 | |||
| Labour | Mary Cheale | 294 | |||
| Labour | Michael Fletcher | 268 | |||
| Turnout | 6,020 | 44.5 | |||
By-elections between 1999 and 2000
| Party | Candidate | Votes | % | ± | |
|---|---|---|---|---|---|
| Conservative | 911 | 47.0 | +1.8 | ||
| Liberal Democrats | 858 | 44.3 | +6.9 | ||
| Labour | 168 | 8.7 | -8.7 | ||
| Majority | 53 | 2.7 | |||
| Turnout | 1,937 | 37.0 | -8.8 | ||
| Conservative hold | Swing | ||||
References
- "St Albans". BBC News Online. Retrieved 7 January 2015.
- "How Britain voted: Council Election Results". The Independent. 8 May 1999. p. 12.
- "Only a quarter of the electorate turned out to vote in one ward as the first all-out council election for 25 years failed to capture the public's imagination". Hertfordshire County Publications. NewsBank. 29 May 1999.
- "How the nations voted". The Times. 8 May 1999. p. 48.
- "District Council Elections 6 May 1999 results". St Albans City and District Council. Archived from the original on 13 April 2001. Retrieved 7 January 2015.
- "Local Authority Byelection Results - December 1999". Local Authority Byelection Results. Archived from the original on 10 August 2014. Retrieved 8 January 2015.
| Metropolitan boroughs |
|
|---|---|
| Unitary authorities |
|
| District councils (England) |
|
| Welsh councils |
|
| Scottish councils |
|
| National Assembly elections | |
| |