1989 Vincentian general election
General elections were held in Saint Vincent and the Grenadines on 16 May 1989.[1] The result was a landslide victory for the centrist New Democratic Party, which won all fifteen seats, returning James Mitchell to a second term as Prime Minister. Voter turnout was 72.4%.[2]
| |||||||||||||||||||||||||||||||
15 seats in the House of Assembly 8 seats needed for a majority | |||||||||||||||||||||||||||||||
|---|---|---|---|---|---|---|---|---|---|---|---|---|---|---|---|---|---|---|---|---|---|---|---|---|---|---|---|---|---|---|---|
| Turnout | 72.4% ( | ||||||||||||||||||||||||||||||
| |||||||||||||||||||||||||||||||
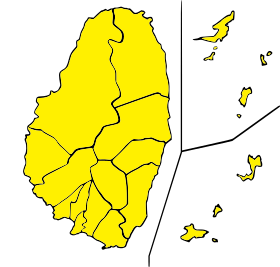 Map of the constituencies of St. Vincent and the Grenadines showing the results of the general election | |||||||||||||||||||||||||||||||
| |||||||||||||||||||||||||||||||

The 1989 election is also the most lopsided in terms of the popular vote margin since the country gained independence in 1979, with the NDP securing a 36-point victory over the second-placed Saint Vincent Labour Party. As of 2017, this is the last time that a single party won over 60% of the popular vote or more than 80% of the constituencies. It is also the last time that North Central Windward, South Windward, and Central Leeward have voted for the NDP.
Results
| Party | Votes | % | Seats | +/– |
|---|---|---|---|---|
| New Democratic Party | 29,079 | 66.3 | 15 | +6 |
| Saint Vincent Labour Party | 13,290 | 30.3 | 0 | –4 |
| Movement for National Unity | 1,030 | 2.4 | 0 | 0 |
| United People's Movement | 468 | 1.1 | 0 | 0 |
| Invalid/blank votes | 351 | – | – | – |
| Total | 44,218 | 100 | 15 | +2 |
| Registered voters/turnout | 61,091 | 72.4 | – | – |
| Source: Nohlen | ||||
References
- Nohlen, D (2005) Elections in the Americas: A data handbook, Volume I, p600 ISBN 978-0-19-928357-6
- Nohlen, p603
This article is issued from Wikipedia. The text is licensed under Creative Commons - Attribution - Sharealike. Additional terms may apply for the media files.